

This is part of a series of statistics articles on Comrades 2025. Other articles published: entry stats, shoe stats, qualification marathon stats, elite men, elite women.
From the Cradle to the Grave
The graph below is a hurricane funnel answering the often-asked question, “What happens to all the entries?”, plotting the fate of the 24,173 Comrades 2025 entries. There was a 6% attrition rate on qualification and 13.2% to get to the start line. This is significantly lower than in recent years with the more relaxed qualification times playing a role.

I’ve included three percentages for comparison – they are based on total entries, total starters and total finishers respectively (e.g. 3.2% of entries finish under 7h30, 3.6% of starters and 4.2% of medallists). A much more detailed analysis on the medal breakdowns as well as overall finish success rates comparisons are available later within this article.
Note: The finisher numbers are for all people earning that medal or better. For example, the ‘Vic Clapham’ value of 18,207 are all finishers (i.e. everyone who finished 12 hours or better).
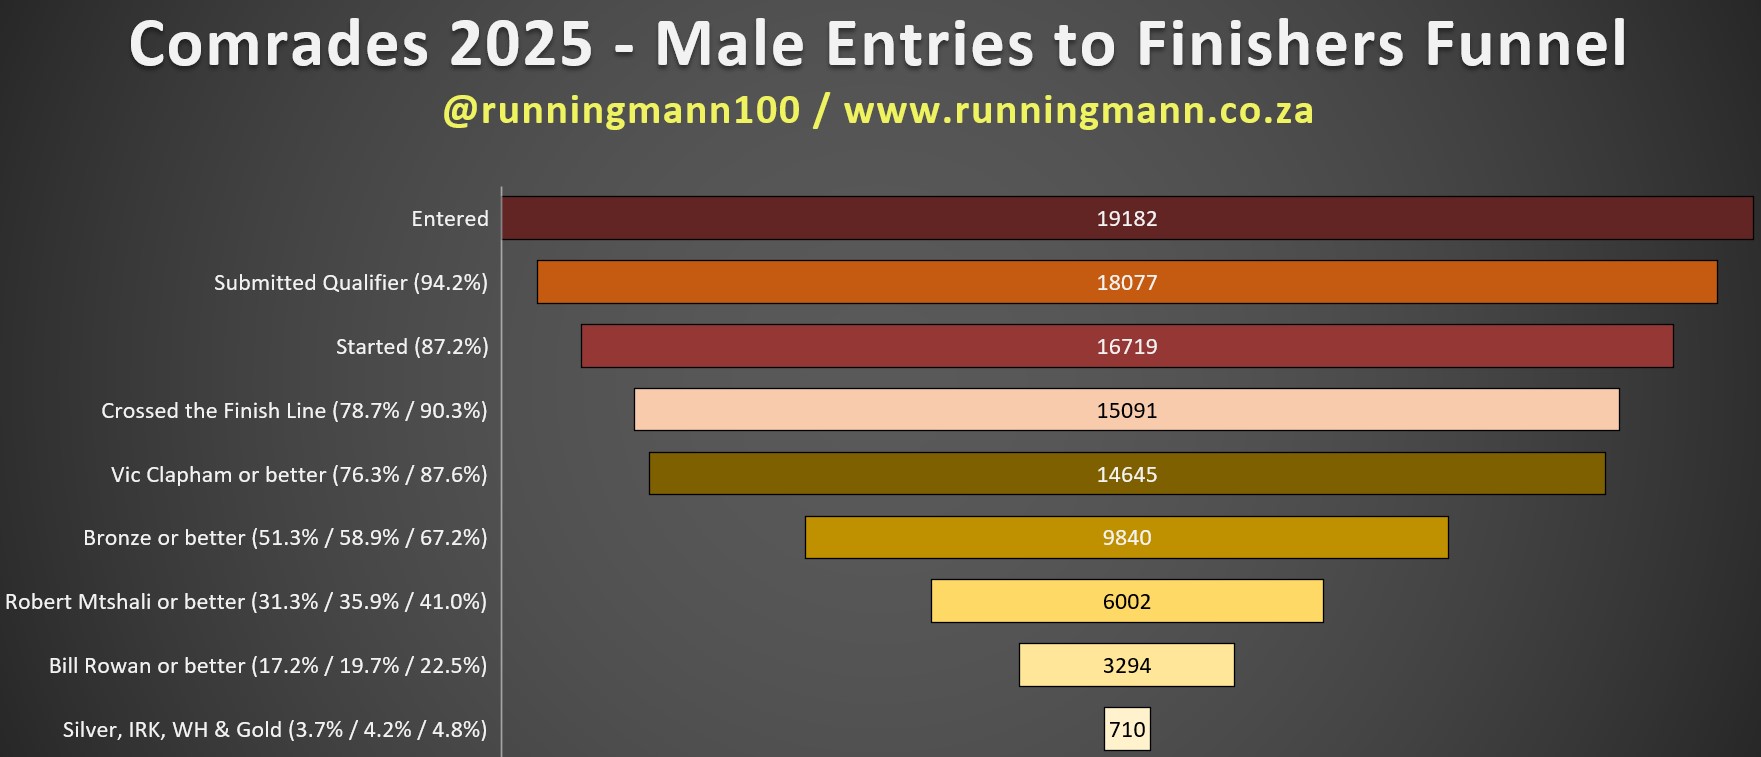
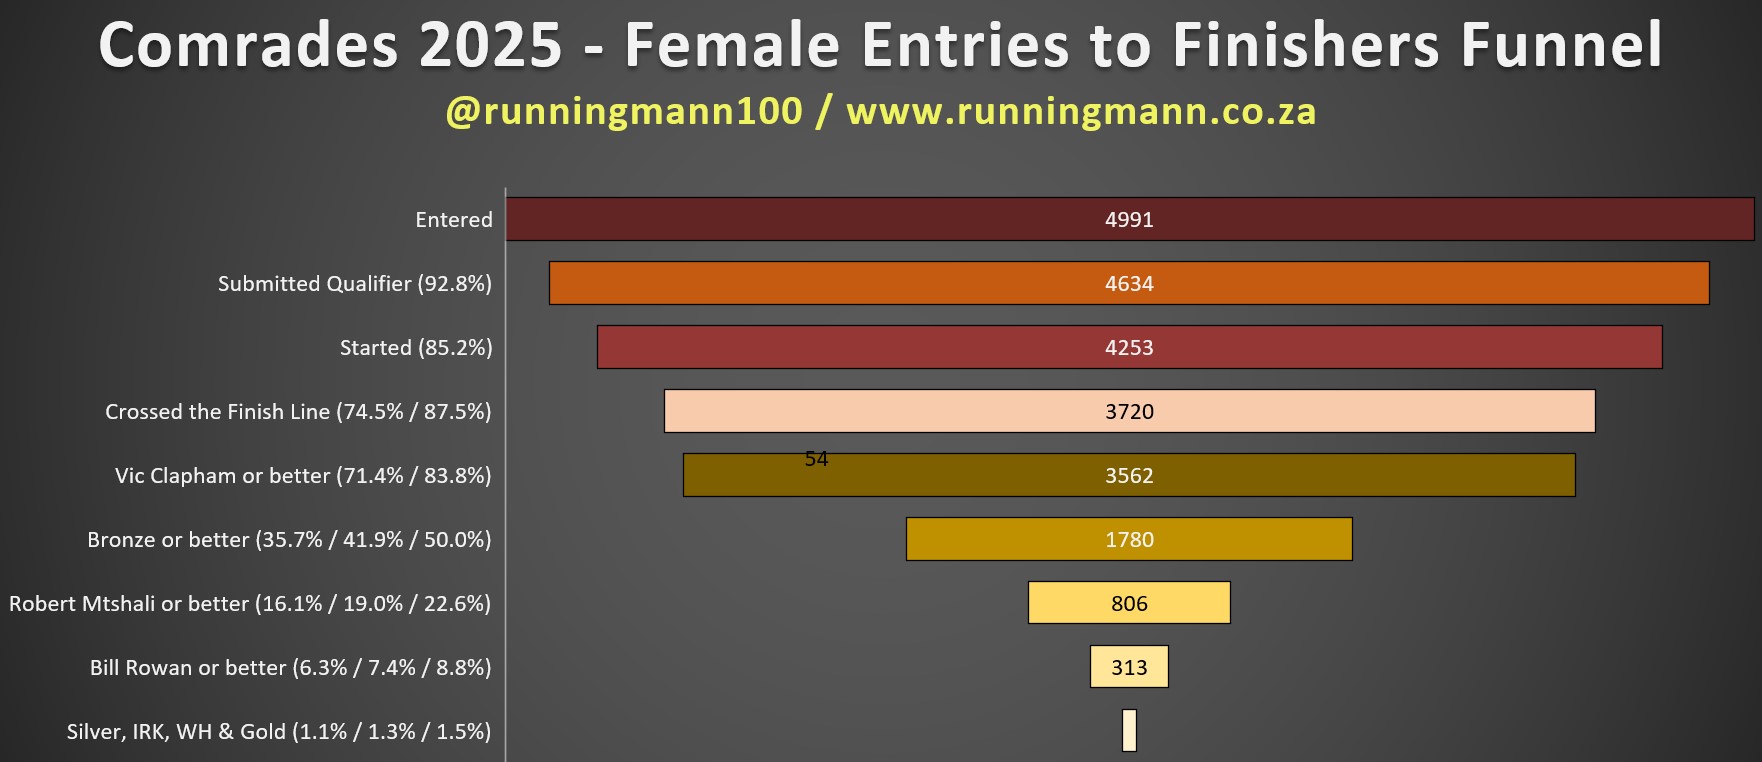
I’ve also done the same graph filtered on men, women and novices.

Finish Rate & Participation Trends
As expected, this year’s finish rate of 86.8% (calculated as the number of legitimate finishers divided by the number of runners crossing the start mat) is down from recent years. There are two big differences impacting this – the shorter 2023 down (and 2024 up) run distances and restoring the 5h marathon qualification time. On the other side of the coin, the two pot start would have resulted in a slightly higher Group 2 finish rate as they saved time crossing the start line.

Therefore, the best point of comparison is the 2018 down run which had a comparable distance and 5h qualification time which was slightly lower at 86.5%. There has been a lot of conjecture that many more people bailed this year than previously but the data says, “All things being equal, Comrades is just as tough as it used to be.” The class of 2025 will be pleased to know that they are no going soft.
The participation trends graph shows a detailed breakdown of entries, starters, finishers and male / female data from 2000 to date. With 18,207 finishers, 2025 is by far the largest down run ever and second behind the 20,016 finishers of the 2000 up run.
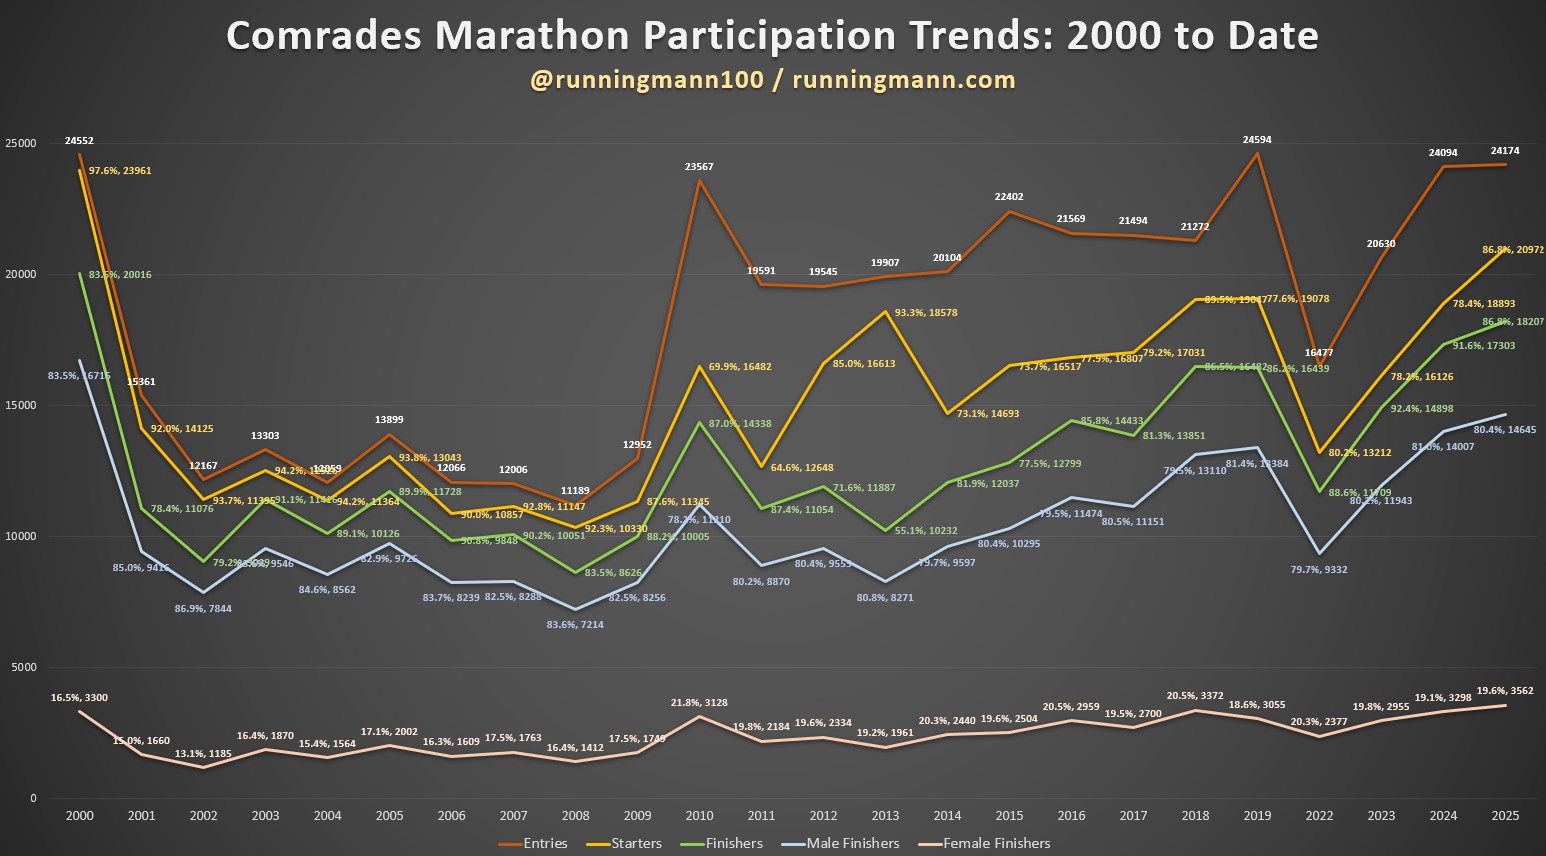
RECORD ALERT: Something that seems to have gone under the radar is that the 3,562 ladies who earned a medal in 2025 means that this is highest number of female finishers ever. This is 262 more than the 3,300 in 2000 (and there were 2,298 last year). I expect that the more relaxed qualification time played a big role in this. However, female participation is still hovering below 20%.
I’ve popped in a couple of graphs below illustrating how the Comrades started its meteoric rise in the 1960s and continued to scale to become by far the largest ultra marathon in the world. There is only one other ultra marathon that’s achieved more than 10,000 finishers (Two Oceans) and, last time I checked, there was no ultra marathon in any other country with more than 2,000 finishers (even a 1,000 is a rarity).


Start Times
The Two Pot starting system (combined with smaller batch sizes) has been a big talking point but it looks to have had the intended results: faster for everyone to get off the mark and a safer race in the early kilometres. The field was able to cross the start line far faster than in previous years. Group One was off in an average of 2m26 and Group Two in 2m41. The full field start time average was 2m33.

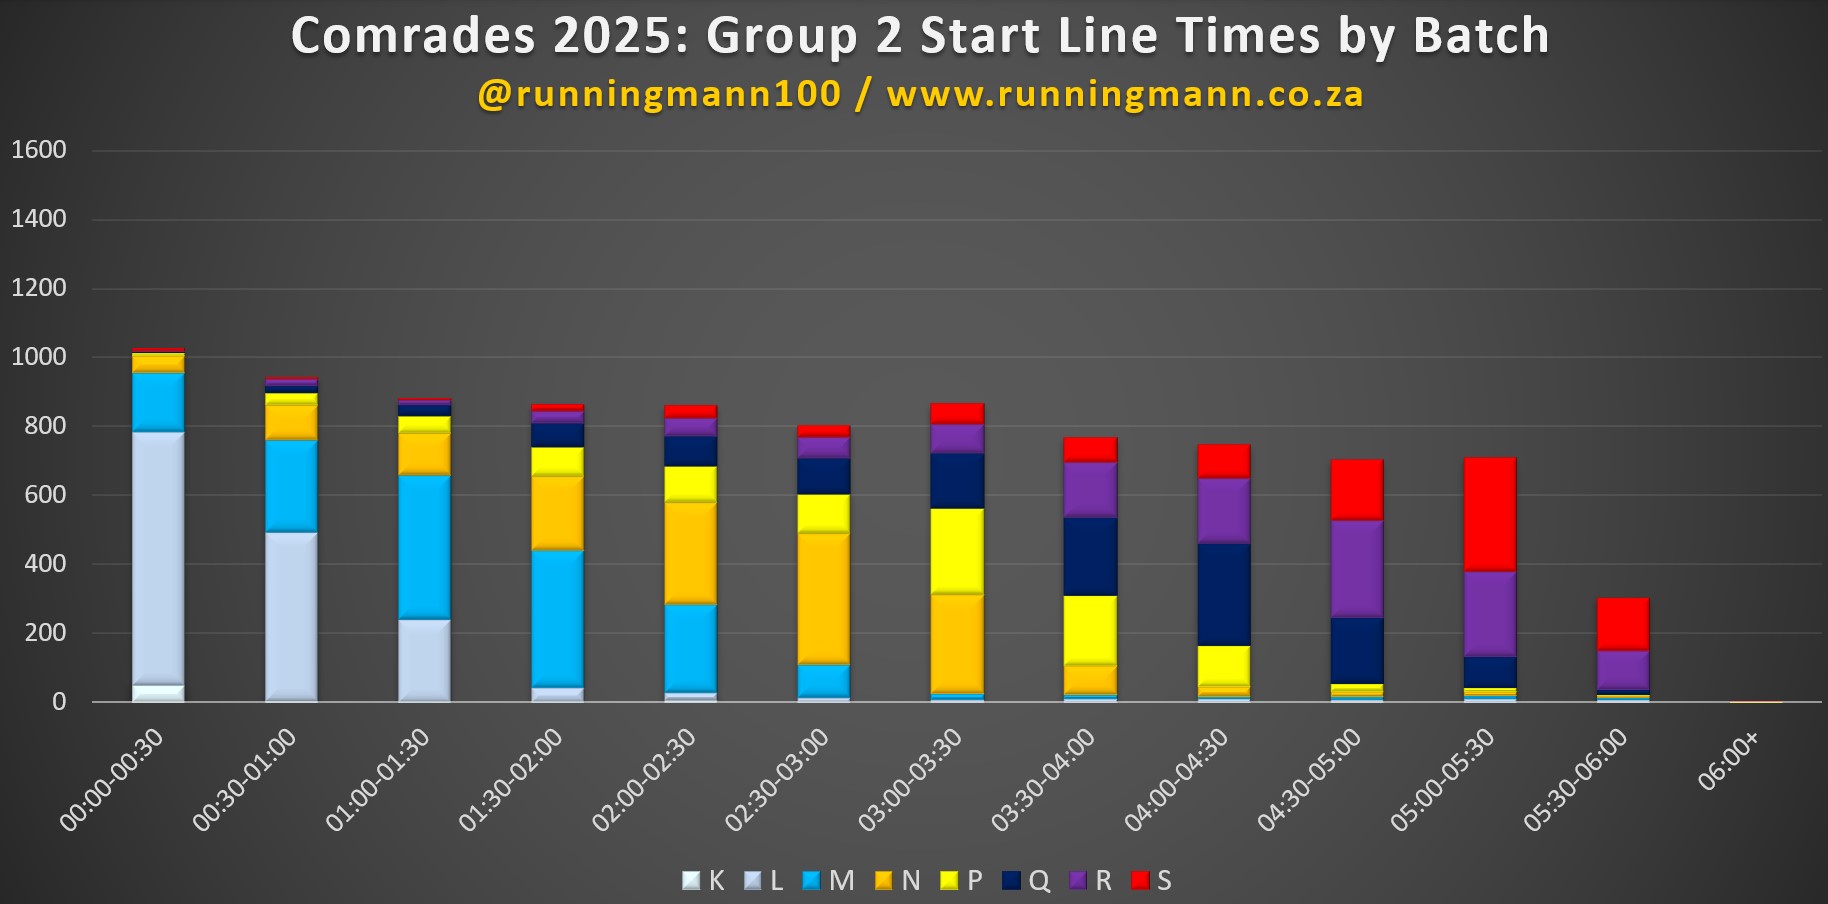
Barring a couple of stragglers, Group One are all out the gates in under 5m30 and everyone in Group Two has begun their journey to Durban in under 6 minutes. This also highlights the correct decision to load about 20% more runners in Group One than in Group Two.
In Group One, over 1,000 run cross the start line every 30 seconds until after 3 minutes. In Group Two this quickly drops to around 800 per 30 seconds after a minute. In previous years, the entire field was throttled to about 800 per 30 seconds after a minute due to some big trucks slowing down the nimbler traffic.

The heat map shows the most common start time for each batch. A and almost all of B is clear within 30 seconds in Group One and most people appear to have stuck to their seeding pens (other than the 19 Group Two runners who got a 15-minute head start). There appears to be a significant number of “Suppositories” (a kind of cheat that pushes through from behind into places they don’t belong) in Group Two. Hopefully they will also be handed a time penalty. I would propose that all these runners are given a Z seeding in future years.
The line graph provides a good visual representation of the start time distribution by batch. It also shows that, whilst there is a definite peak for each batch, there is also a lot of cross pollination amongst the batches, especially further down the alphabet.
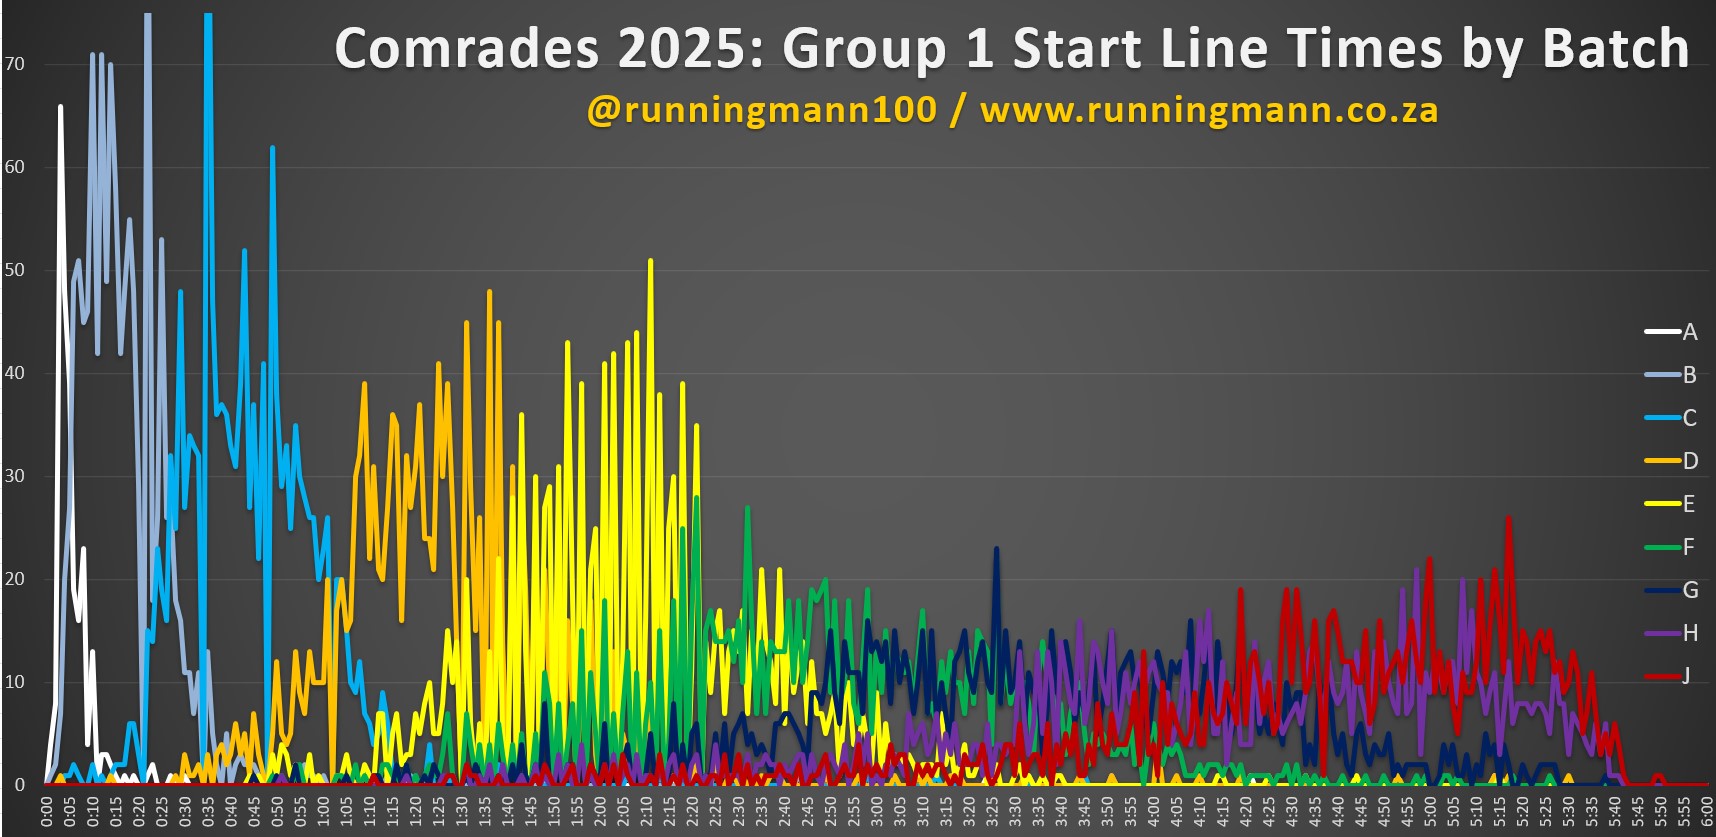

The final graphs show average start time by batch. As one would expect the average increases as one moves down the seedings, from 9 seconds in A to 4m35 in J. There’s a similar pattern in Group Two.


The supporting table provides a male, female and novice split. Perhaps surprisingly, other than in the front batches, the ladies are quickest off the mark. However, novices make the most of the start line atmosphere and generally have a much slower average start time than the rest of the batch.

Note: I never did a full analysis of this information in 2023 but this is significantly faster than in 2022 (and 2025 had 60% more starters). I will do a ‘like to like’ comparison at some stage.
Extra 10 minute Qualification Beneficiaries
There was a lot of demand for this stat: How many of the 4:50 to 5:00 hour marathon qualifiers earned a medal. The answer is 888.
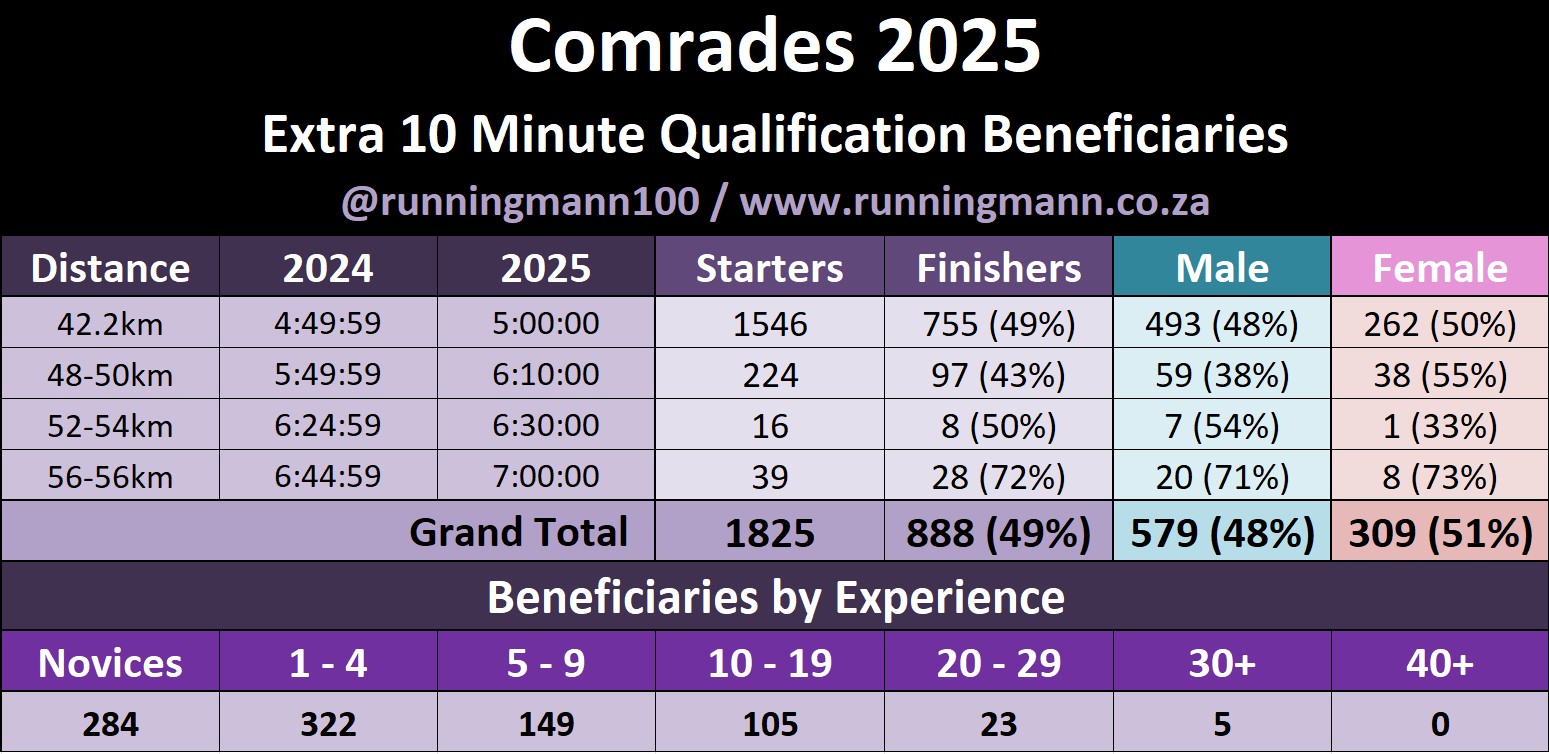
This is just under half (48%) of those who got to the start line with the more relaxed 2025 qualification times with women narrowly ahead of the men in terms of success percentage.
Interestingly, 133 Green Numbers got an extra credit due to the extra 10 minutes and there are 20 brand new members of the Green Number club who would otherwise have had to wait until 2026 to pay their membership dues. This is win for sensible decision making.
Medals by Batch
Here’s a detailed breakdown of the medals earned by batch including segmentation on male, female and novice runners.

This year the A batch included age category contenders and the oldest / youngest entrants in addition to sub-2:25 men and sub-3:00 ladies but, even so, on paper one would have expected more than 56% of this batch to earn silver or better. However, 90% of B batchers are done before the 9 hour mark and the biggest single medal-batch cohort are the 69.4% of Cs that earn a Bill Rowan.
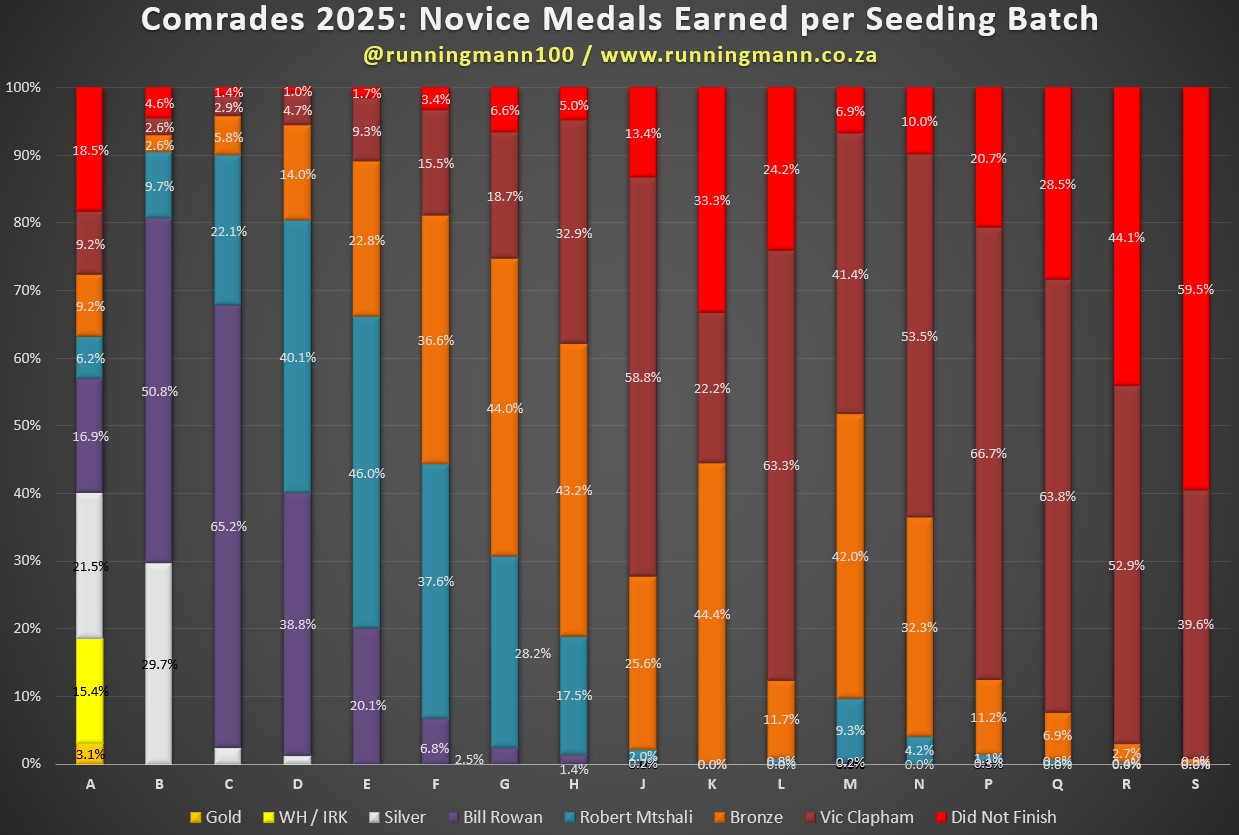
On the other extreme, over 98% of S, 95% of R and 90% of Q finishes over 11 hours or not at all. Traditionally, A has a fairly high attrition rate but from B to F the DNF percentage would increase gradually and then have a major jump at G and again at H.
The smaller batches produce a slightly different results. Attrition in A is still very high but the best performers are C, D and E who all hover just above 2%. G batch runners are weaker than those in F and H. Almost 1 in 4 from L (the Green, Yellow and charity batch) don’t go home with a medal and this rises to over half of those at the back of the field in S.


Also included is a table below providing a heat map showing what medal most of each batch achieves. More detailed analysis is provided in the tables which include the number of runners as well as the percentage by medal, the fastest male and female time as well as the average time.

Of note:
- 43% of B batch achieve a silver medal or better
- 4 from B earn a Wally Hayward
- There were 14 Silvers from D and 2 from M
- A Bill Rowan medal is earned all the way to P batch (well done to the solitary Bill from P batch earned by Bongani John Nkosi from ABSA Running Club)
- A Robert Mtshali medal is earned by every batch (well done to the solitary Bob from S batch earned by Mondli Lethuxolo Gumede from Hollywood AC’s KZNA branch)
Beat your Batch
Are you ‘better than the average Comrades runner’? Here’s the average finish time per batch along with segmentation for male, female and novices.
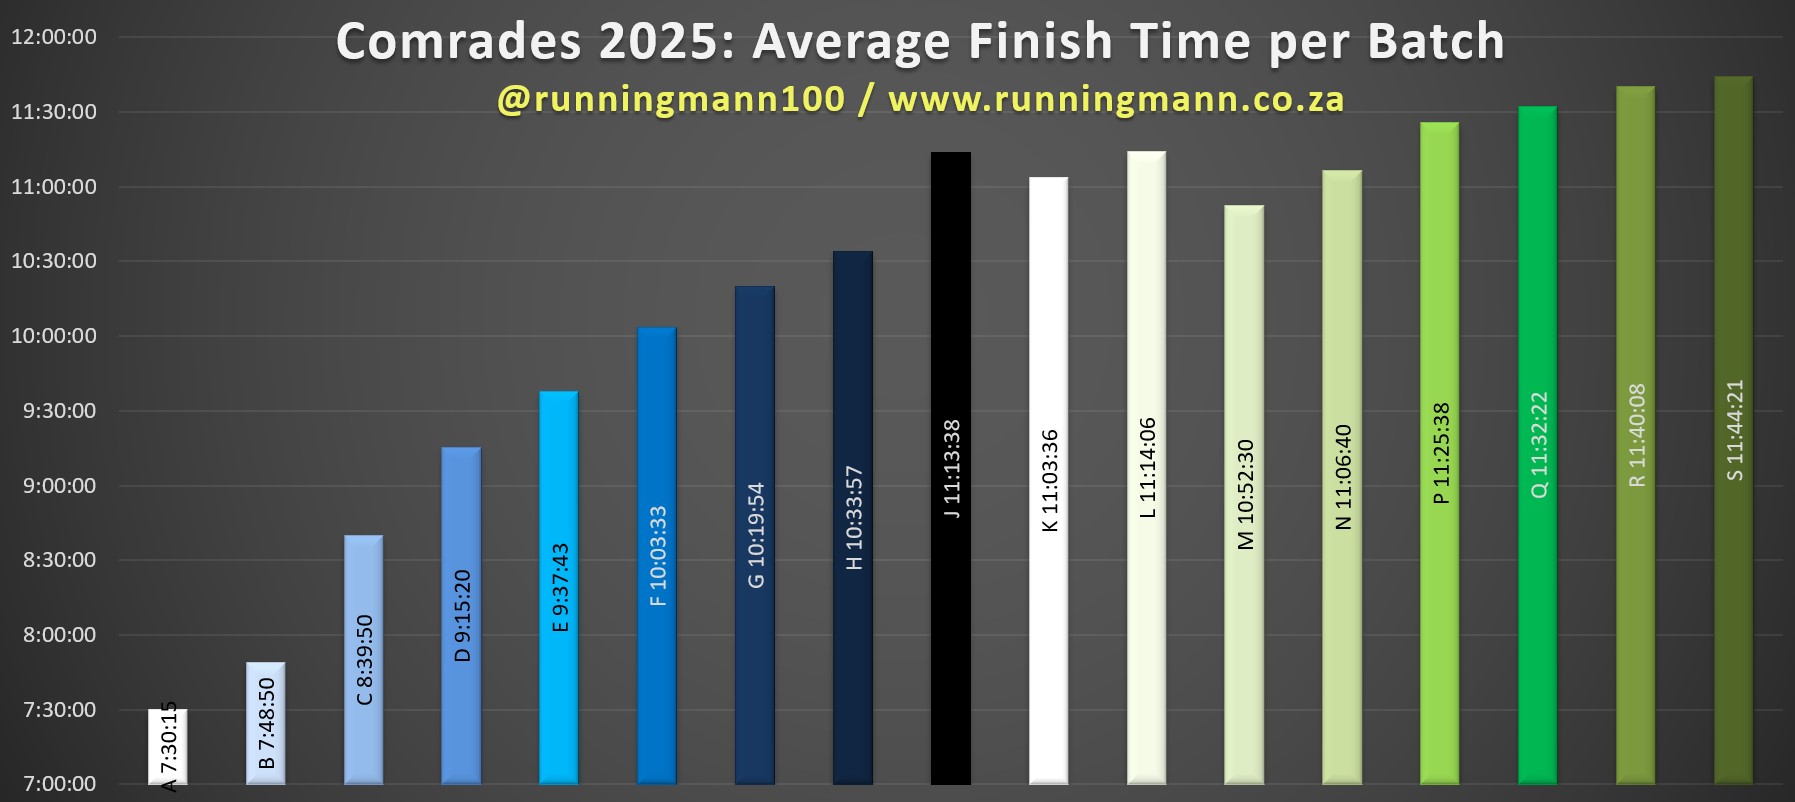
No surprises that the average time increases as one moves up the alphabet with the exception of J at the back of Group One (who ran slower qualifiers than M and N). Louis Massyn’s K batch and the Green and charity runners in L are also slower than their contemporaries. However, B batch produces some surprises with both the ladies and novices running faster on average than the As (but it should be noted that the sample size of B ladies is just two).


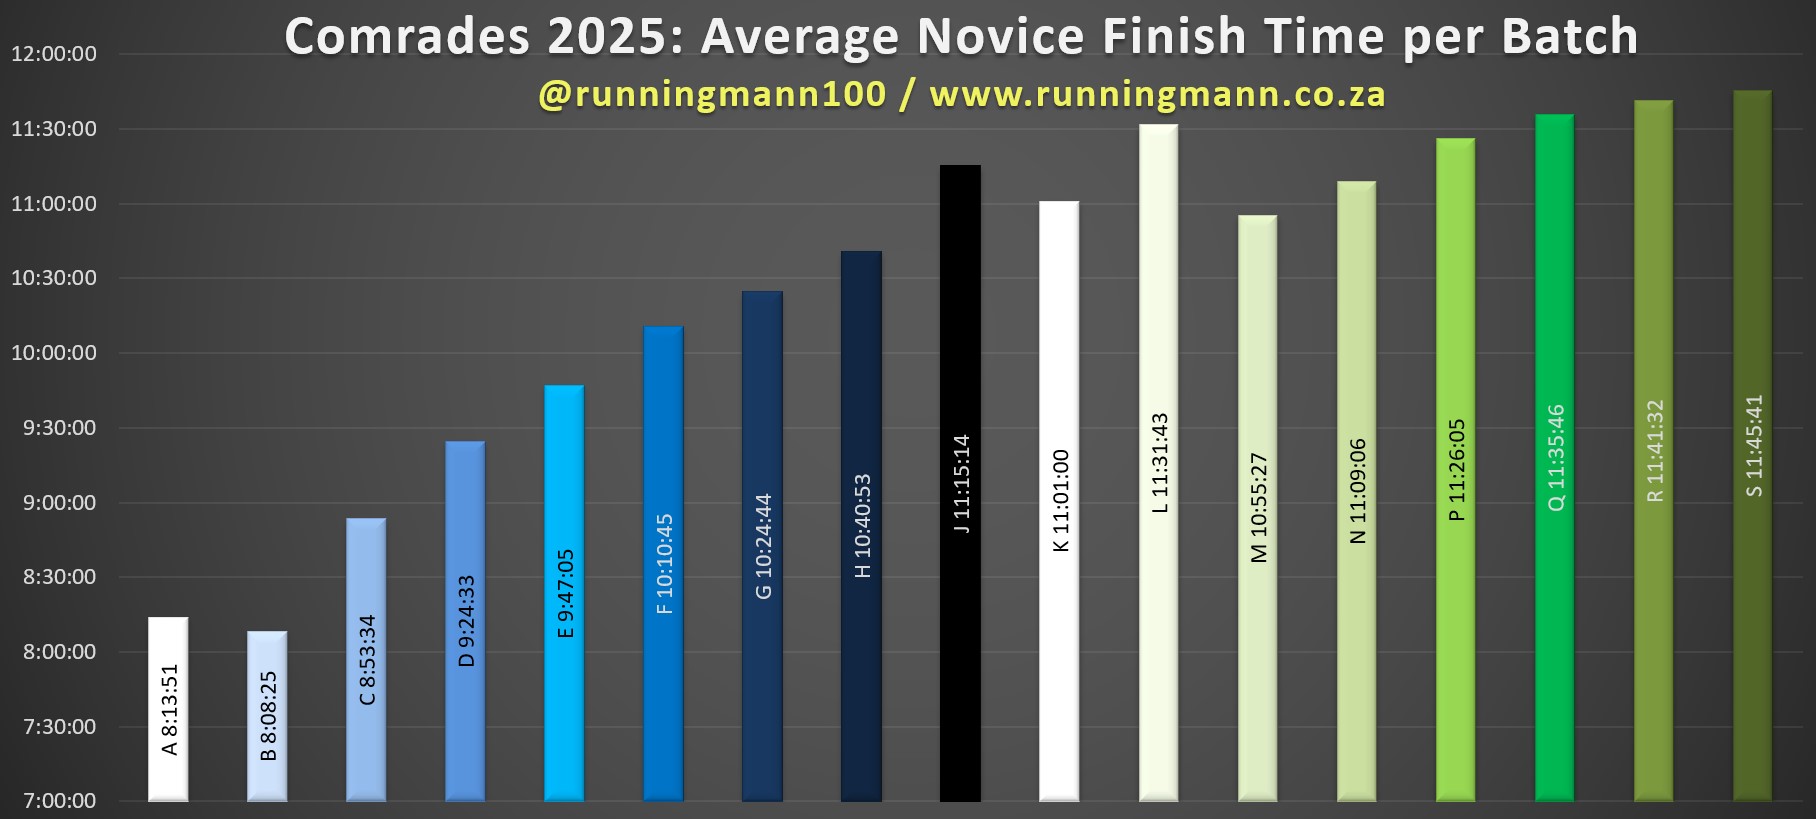
More evidence that ego and testosterone are a handicap when running ultra marathons is that the average female time per batch is generally superior to the average male time as one moves down the seedings (see https://runningmann.co.za/2023/05/11/run-like-a-girl-pacing-at-comrades/ for a previous detailed article). Novices fare worst of all and their average times are far slower than their more experienced peers.
Fastest from Group Two
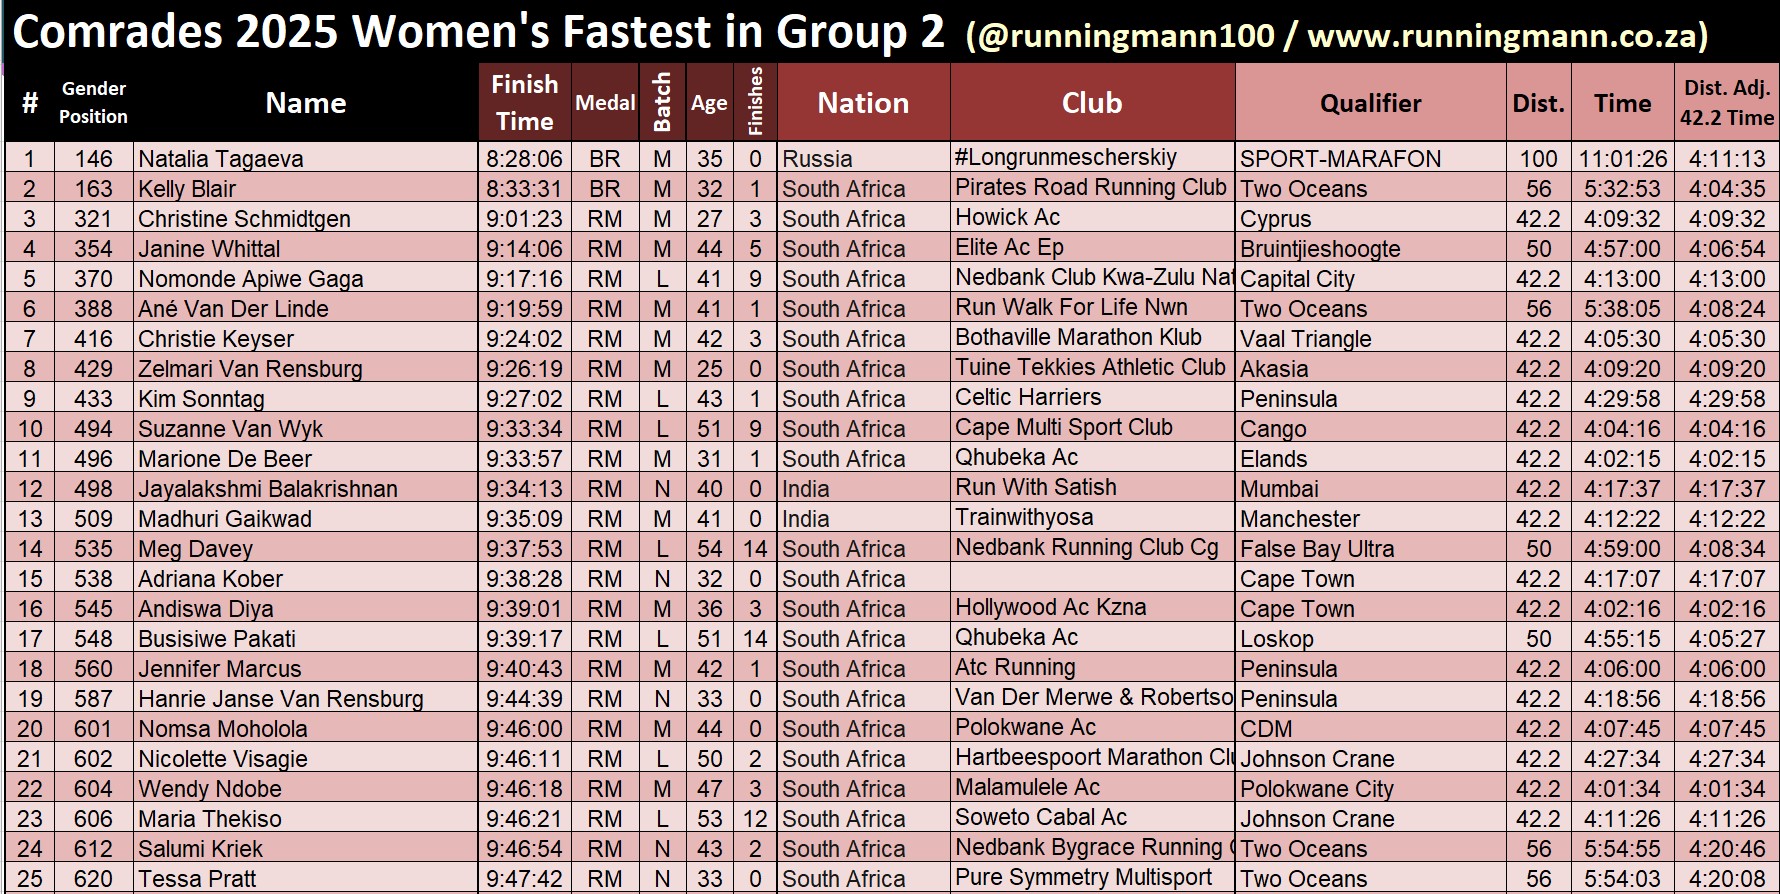
The men’s winner of Group Two was Xolani Ngcobo from Kwamashu AC with a solid silver 7:19:23. Another local runner, Patrick Dlamini from Ama-Ravens AC, claimed the other silver in the second group. There were a further 19 Bill Rowans and 242 Robert Mtshalis, highlighting that there was very little cross pollination between the two starting groups.

On the ladies’ side there were just two Bill Rowans from Russian Natalia Tagaeva (who qualified with a 100k race) and Kelly Blair from Pirates. Group Two women also contributed 70 Robert Mtshalis to the total medal haul.
Cross Group Pollination
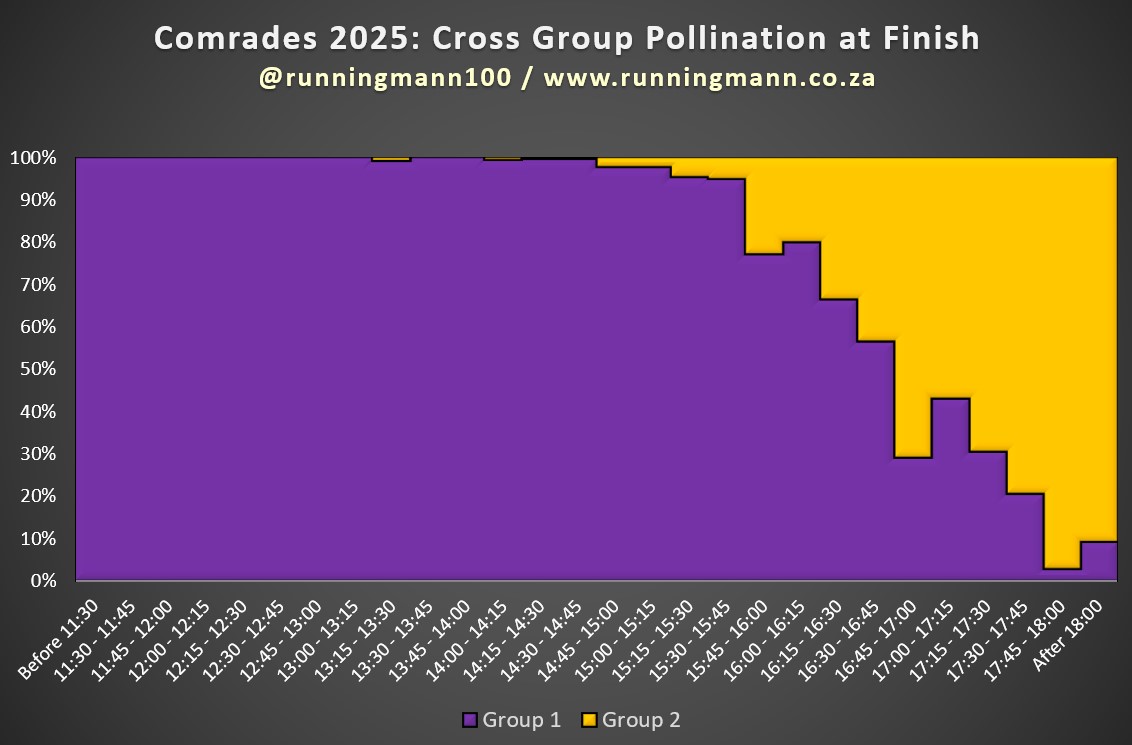
By request, here is a graph showing those crossing the line from Group 1 and 2 in 15 minutes increments. It all purple from Group 1 until well into the afternoon. The first time we see a surge of orange from Group 2 is just before their Robert Mtshali 10-hour cutoff. Group 2s gradually increase but finally dominate the finish line at 5pm with their 11-hour bronze medal cutoff. There are still a decent number of purples earning Vic Claphams but over 97% of finishers before the bugle is blown at 6pm are from Group 2.
Batch Bosses
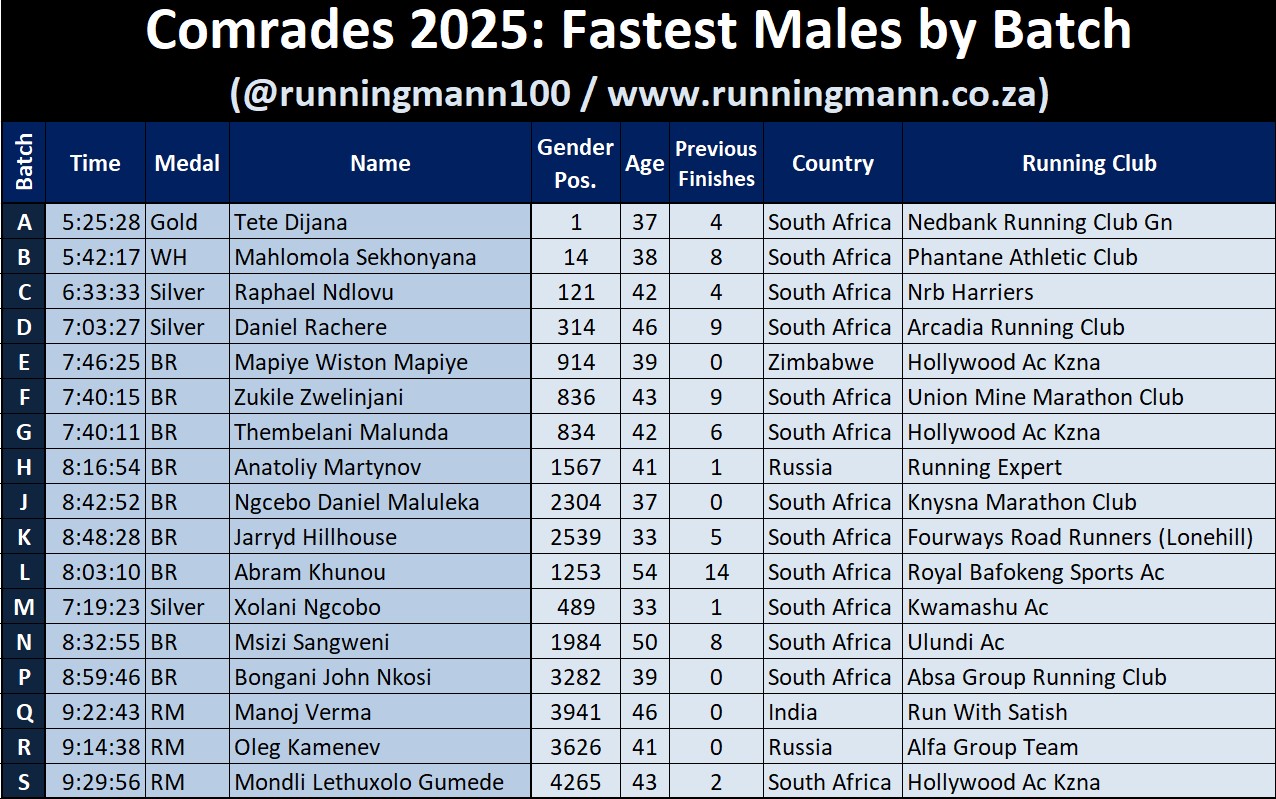
Who was the boss of your batch? Here’s the male and female ‘winner’ from each batch. Abram Khunou from Royal Bafokeng secured bragging rights from L, the Green Number batch at the front of Group 2 and is the oldest batch boss at 54. Daniel Rachere from Arcadia got his green in style from D with a solid silver.
On the ladies’ front, former gold medallist Belinda Waghorn shows the youngsters how it’s done from E as the only master on the list with her Green Number run. No women in their 20s make the list with the youngest being 32-year-old Lesego Mogolane from F.

Comrades Runners are Goal Driven
The graph below shows how many runners crossed the finish line every 15 minutes. Humans are goal (or medal) driven and it’s the normal Christmas tree, pagoda pattern for each medal cut-off with a ‘love handle’ on the last 15 minutes for each medal.

In behavioural science this is known as the “goal gradient effect” where people tend to work harder and faster as they get closer to a specific goal or target (plus a little bit of round number bias and loss aversion thrown in for good measure).


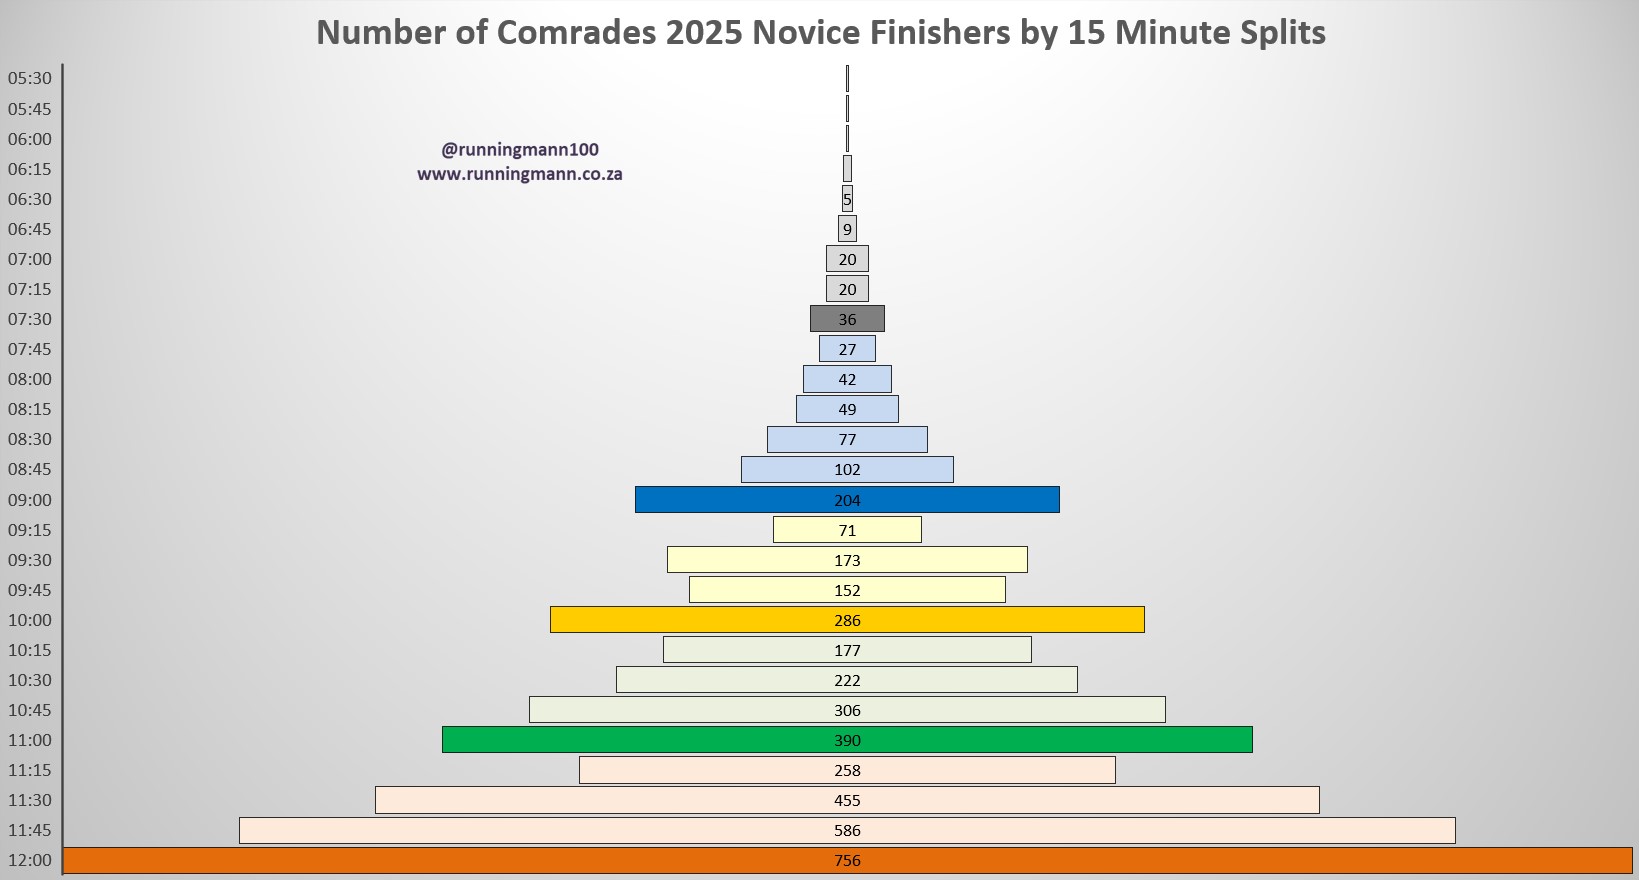
I was wondering whether the two 10h buses who were operating on Africa-time and arrived at +/- 10:07 would ruin my data this year but the pattern holds true in 2025.
Breakdowns by gender and novices follow the same trends. The doughnut graphs are the same data set in a format that provides a different visual of the percentages by 15 minutes split.


Finish Accumulation
This graph shows the cumulative percentage of finishers by 15 minute intervals. This makes it apparent that women get the most value for money for their Comrades entry. Novices also tend to make a cautious start into Comrades running.
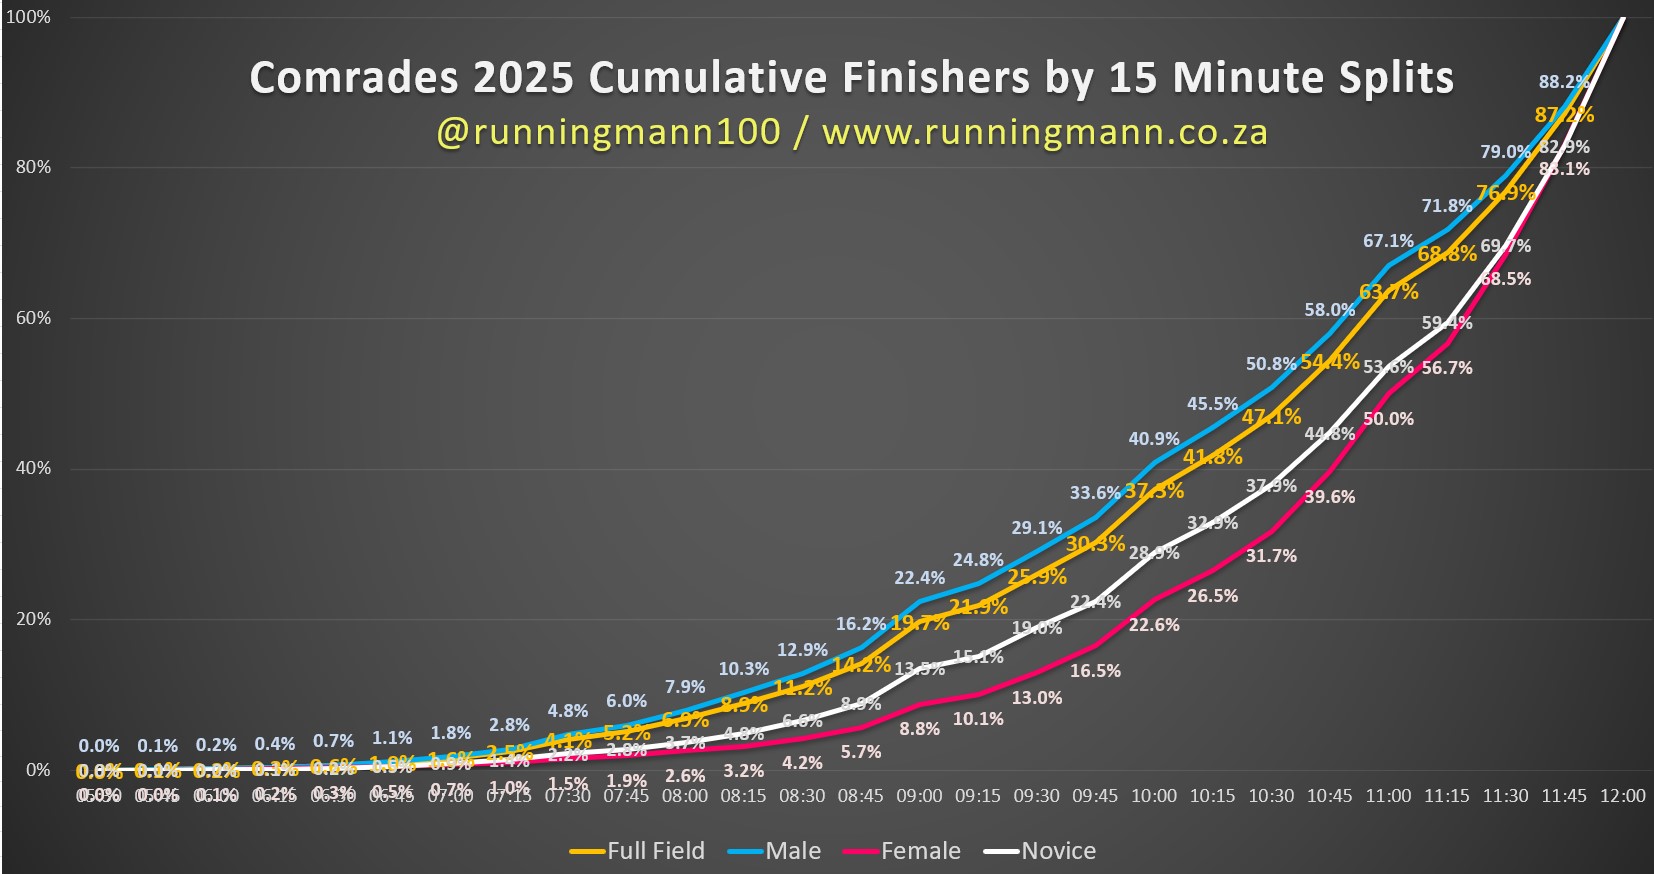
As the saying goes, “If it wasn’t for the last minute nothing would ever get done!” This year 12.7% of the field wait for the last 15 minutes to earn their medal, 36.2% finish in the last hour and over half the field (52.9%) in the last 90 minutes.
The average time at this year’s race was 10:18:05 whilst the median was 10:37:19. The second graph provides the same information but is displayed on an absolute (rather than cumulative) basis by number of runners crossing the line every 15 minutes.

Finisher Summaries (Age, Medal & Gender)
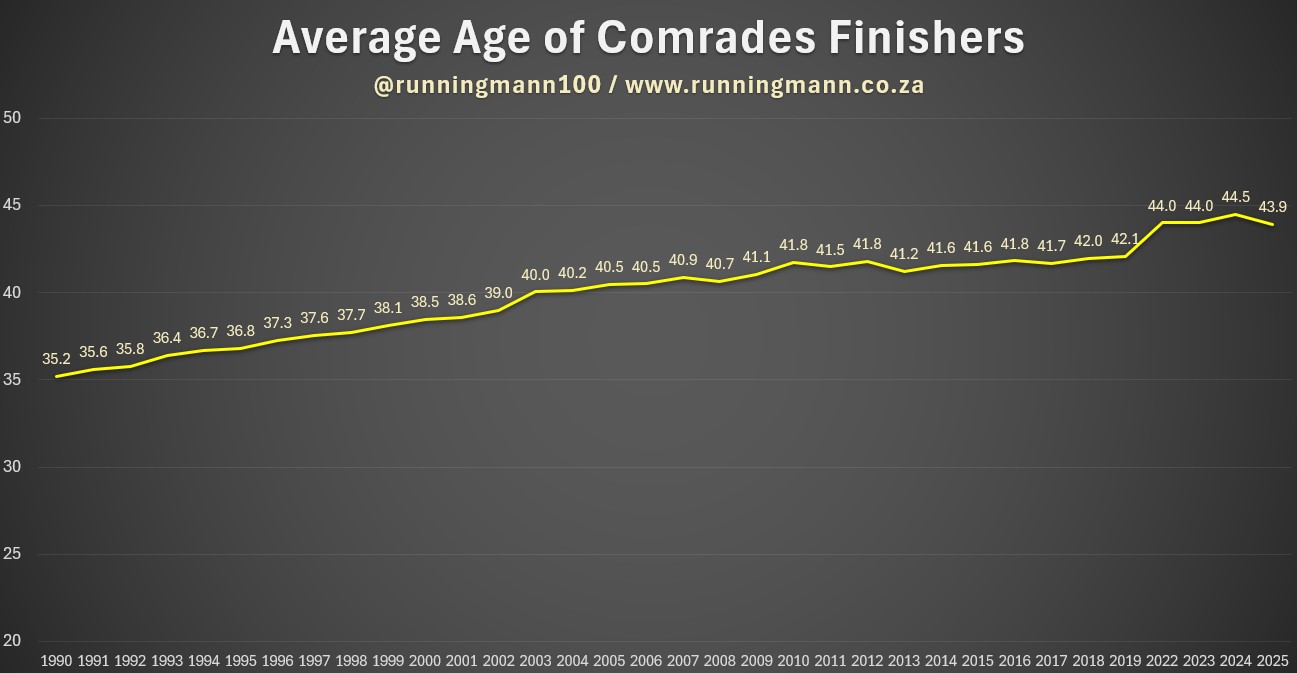
For the first time in since 2013, the average age of this year’s Comrades finishers fell to 43.9 (from the record high of 44.5 in 2024). The average age was 42.5 for women, 44.3 for men and 40.3 for novices.
Using the traditional ‘prizegiving’ age categories, the 40-49 veterans category comprised 44% of the finishers and just 5% are over 60 years old. Of concern is that just 31% of the field are in 20-39 open category especially considering this is a two decade bucket. The ladies are slightly better represented in the youth category with 36% compared to 29% for men.

It may surprise some that only 36% on the field finishes in the last hour (many people quote “50%”). However, 60% do finish in the last 2 hours (this is consistent on the up and down runs) and 50% of the female field goes home with a Vic Clapham medal.

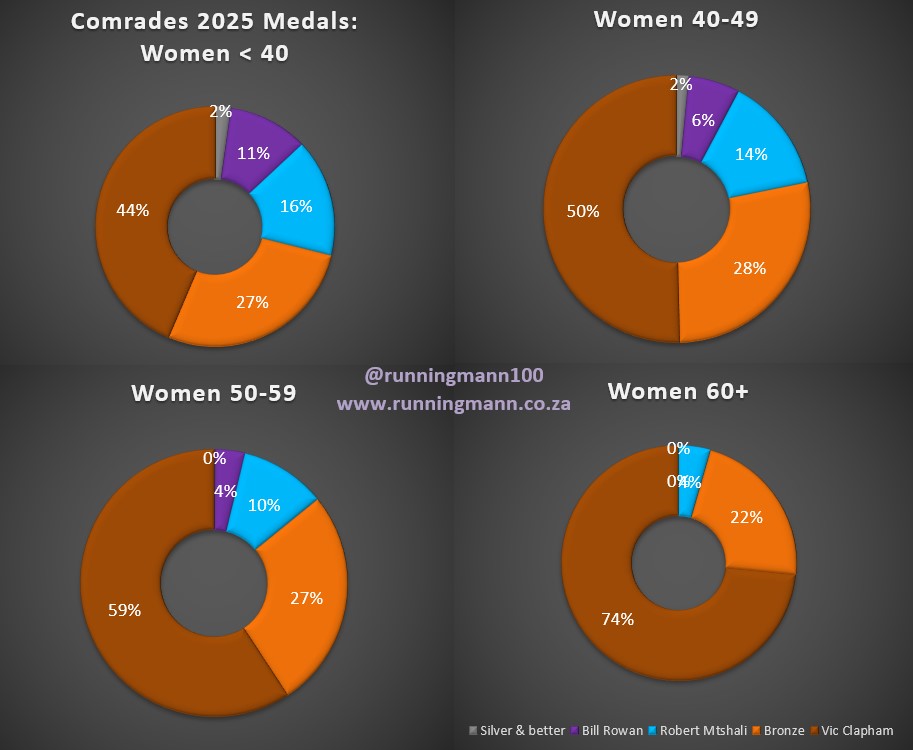
There is a big difference in the medal distribution for men and women. One in four men finish Bill Rowan or better whereas only one in ten women manage the same feat. Three in four female starters will finish in the last 2 hours compared to just over 50% of men. It’s also interesting that a similar percentage of men earn a Bill Rowan and Robert Mtshali medal (which also happened in 2024).
The remaining doughnut graphs provide a breakdown of medals earned by age and gender. As one would expect, the medals earned percentage is heavily correlated to age with older entrants taking longer to claim their laurels.

The table provides a detailed summary of all information within the graphs.

Here’s the finishers by age breakdown in five year cohorts.
Just under 65% of the finishers are between 36 and 50. Extending by five years on each side to 31 to 55 comprises a massive 86% of medals earned. Most Comrades runners take early retirement – there are less than 200 finishers over 65. There are just 173 finishers 25 and under and less than 1000 under 30. The kids of today…

The male and female charts are very comparable with a slight difference with a higher percentage of women between 36 and 45, a trend that is reversed in the older categories.


I’ve tracked novices separately. Interestingly, the bell curve is very similar but everything happens 5 years earlier with 77% of novices being between 31 and 50 years of age.

By request, here’s a more granular analysis of the medals earned by age. Your best time to earn a silver medal is in your mid to late 20s and drops significantly once you reach 40. Anyone over 50 running under 7h30 is defying the odds.

Robert Mtshali and Bronze medallists remain fairly constant percentwise until 60+. The Bill Rowan is the only medal that peaks with the youngsters and steadily decreases with every cohort whilst Vic Claphams are their lowest in the 31-35 grouping and then steadily increase from there.
Graphs for men, women and novices are provided as is a table with detailed figures.


Where your Comrades fell in 2025
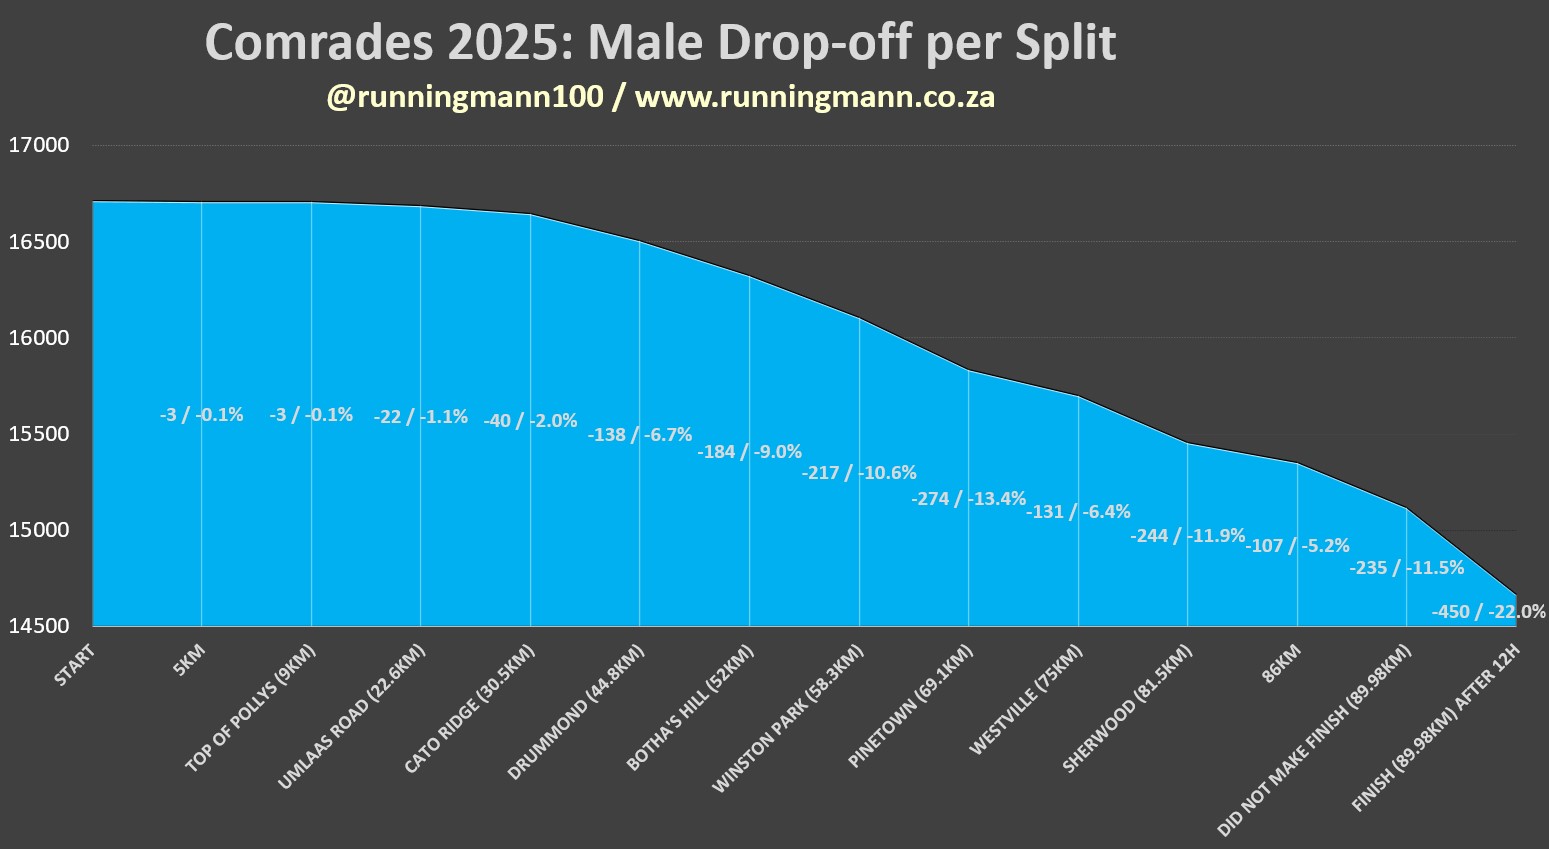
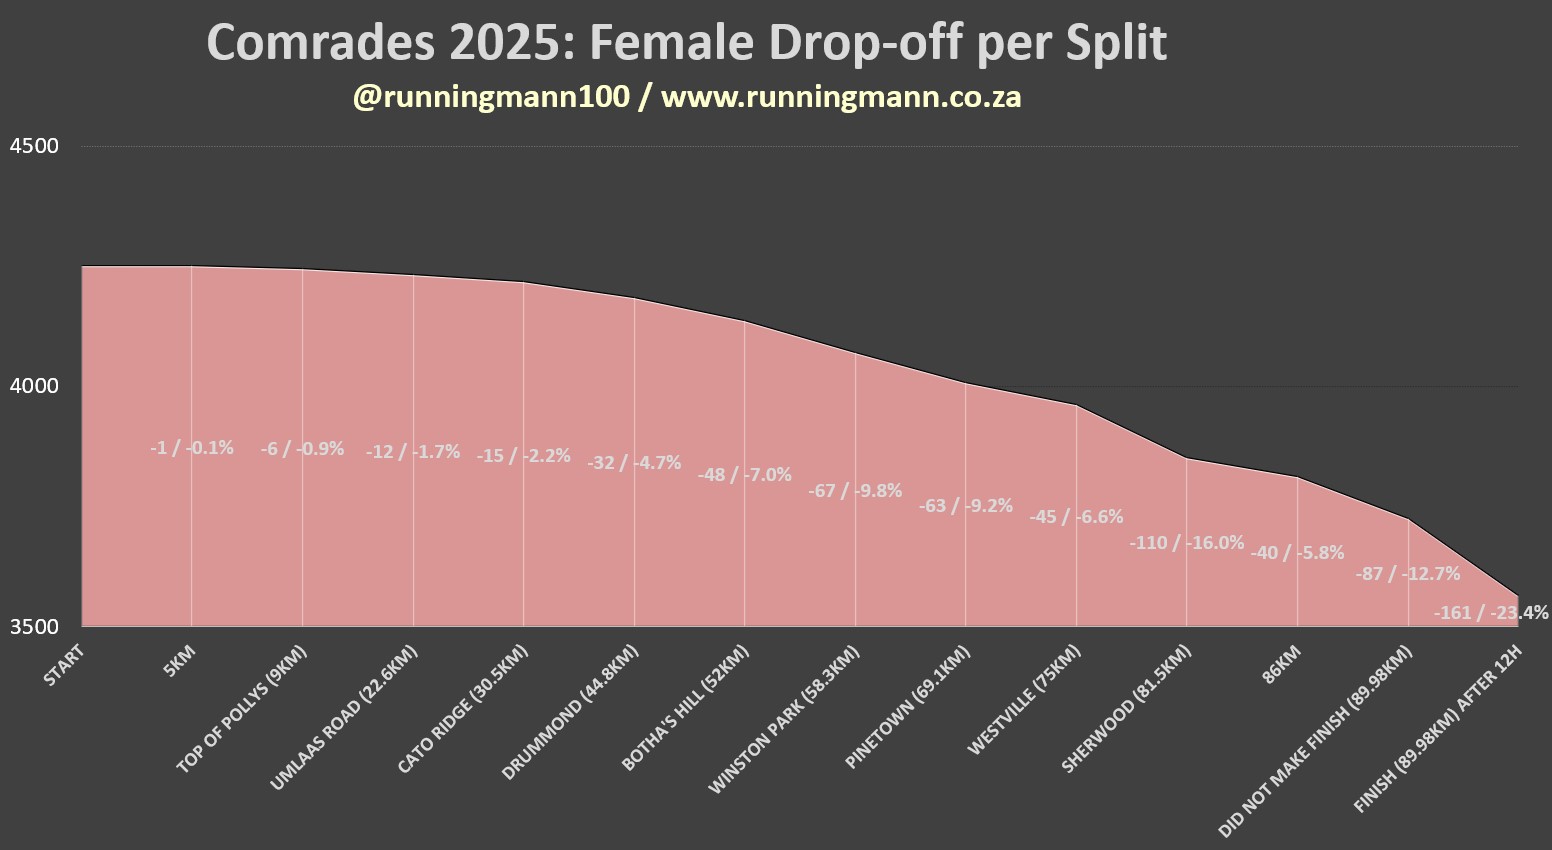
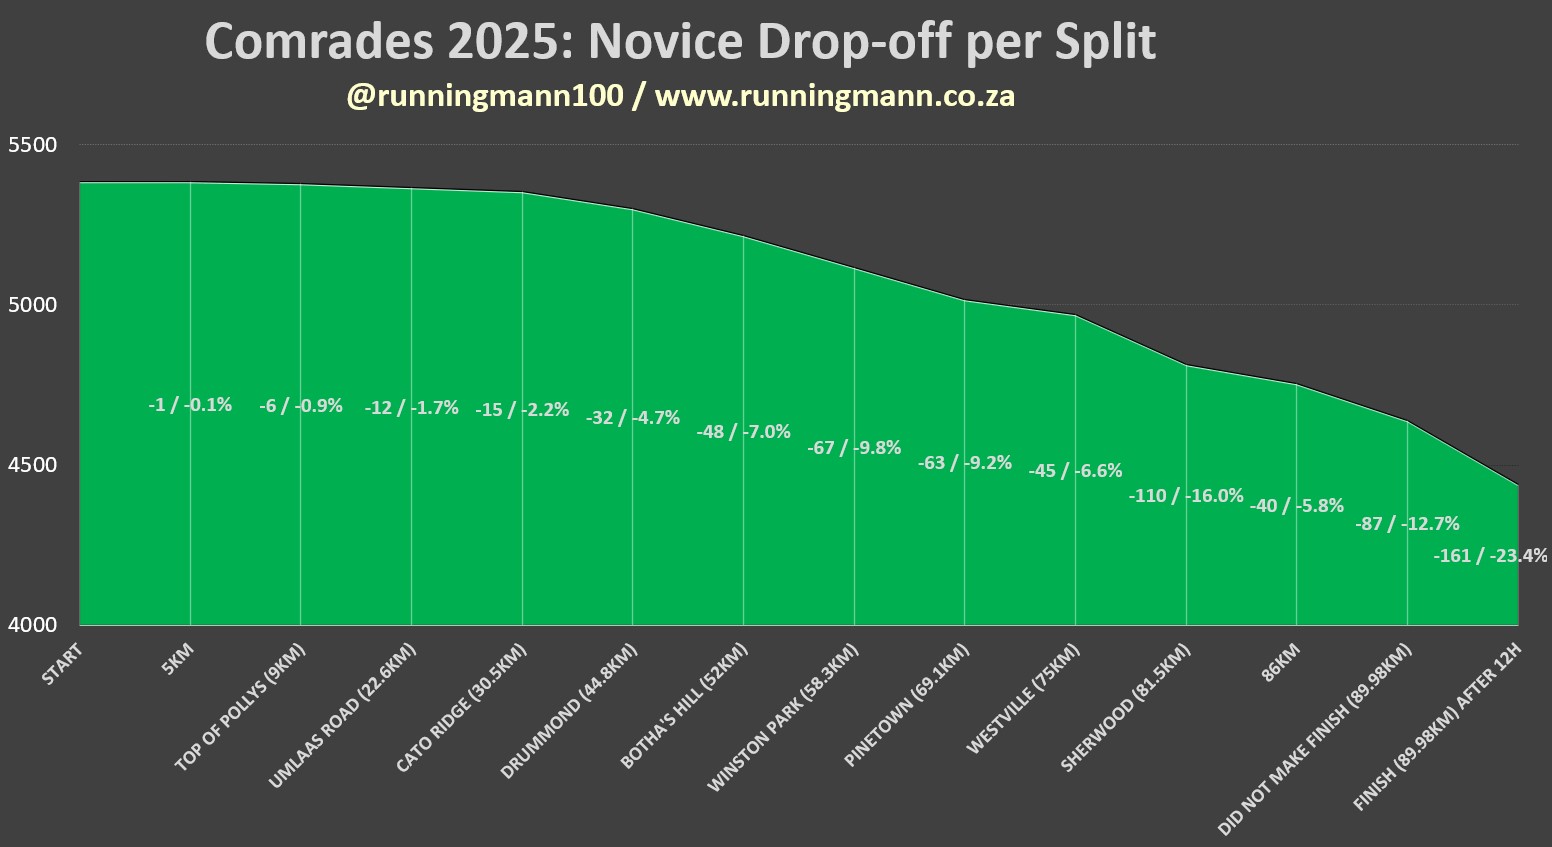
If you’ve done the training, anyone can get to the halfway mark of Comrades. Comrades provides a great illustration of just how important our minds are when completing really arduous tasks. Another way of phrasing this is that, it’s not how you start and it’s not how you finish, but rather it’s how you deal with the middle that will determine success.

Less than 100 of the almost 21000 starters drop out before the halfway mark, it’s the doldrums after halfway that account for the largest proportion of the non-finishers at Comrades. However, this year the stats are slightly different in that there is still quite a significant drop over the last 10km (normally this is pretty flat). I would guess that the more relaxed cutoffs are responsible for this change.
I was surprised to see (and did double check the data) that there were 322 people who crossed the 86km timing mat but not the finish line (there were an additional 611 people who crossed the finish line after 12 hours for a ‘I’ve gone the distance’ technical knockout).
I’d also be interested to hear about the 4 people who started but didn’t make it to 5km and the 9 who called it a day before getting to the Top of Pollys timing mat.
For interest, I’ve done separate graphs for Group 1 and Group 2. As one would expect, the Group 1 graph is a lot flatter whereas the Group 2 hits double black diamond territory over the second half.
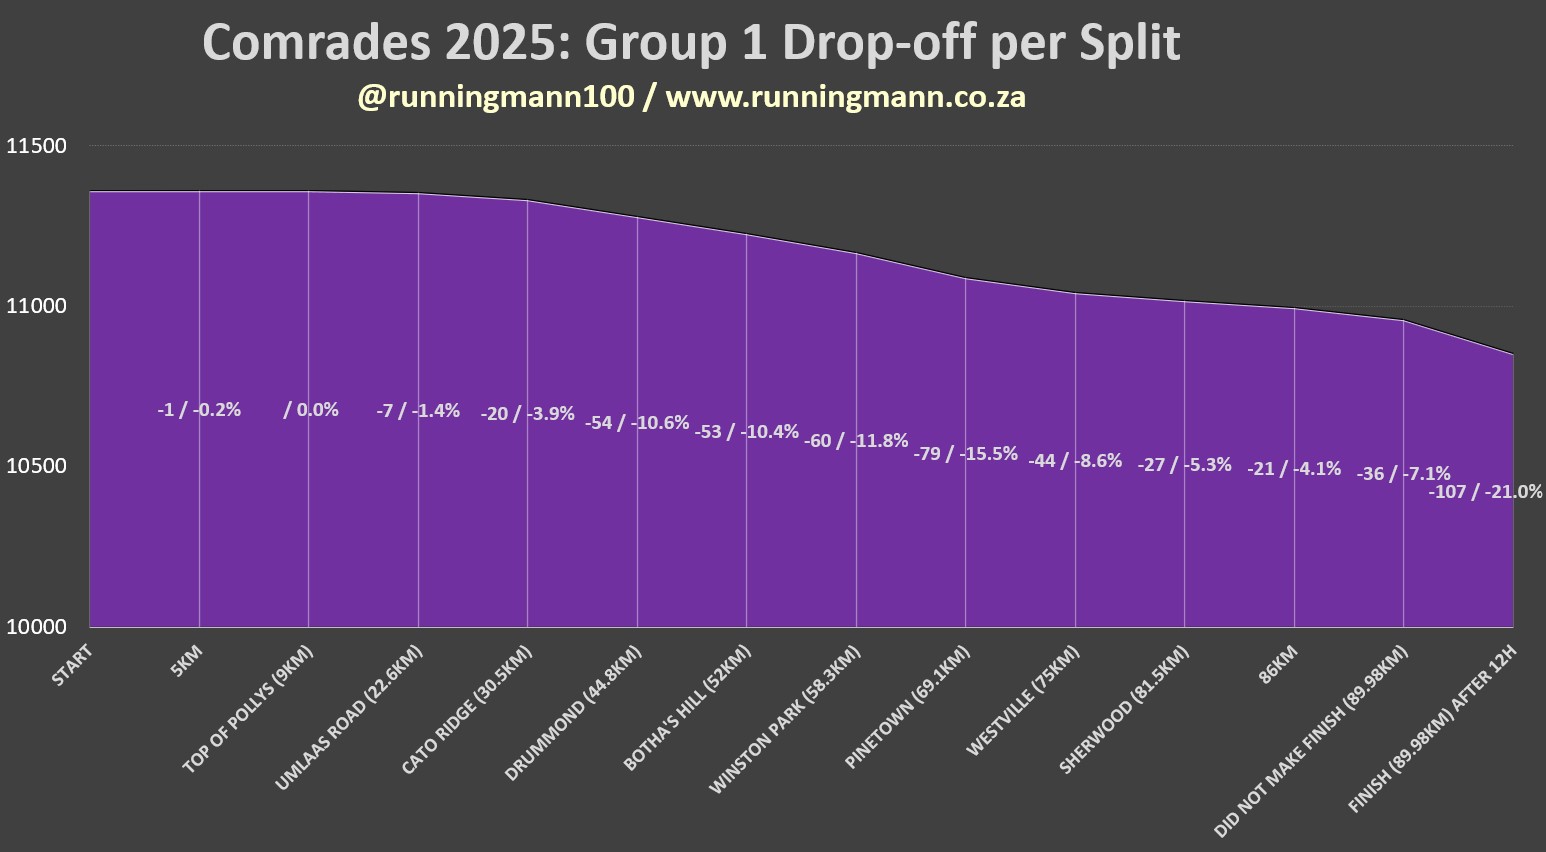

Also include a graphs segmented for male, female and novice runners. Interestingly the novice trend follows the female trend closely.
Cutoff Calculations & Beneficiaries
How many people benefitted from the more lenient / sensible cutoff times this year? The statistically correct answer is 105 (3 at Drummond, 66 at Pinetown and 36 at Sherwood indicated in the Kermit lime green highlight). However, the analytically correct answer when comparing to 2023 is ‘over a thousand’. Let me explain…
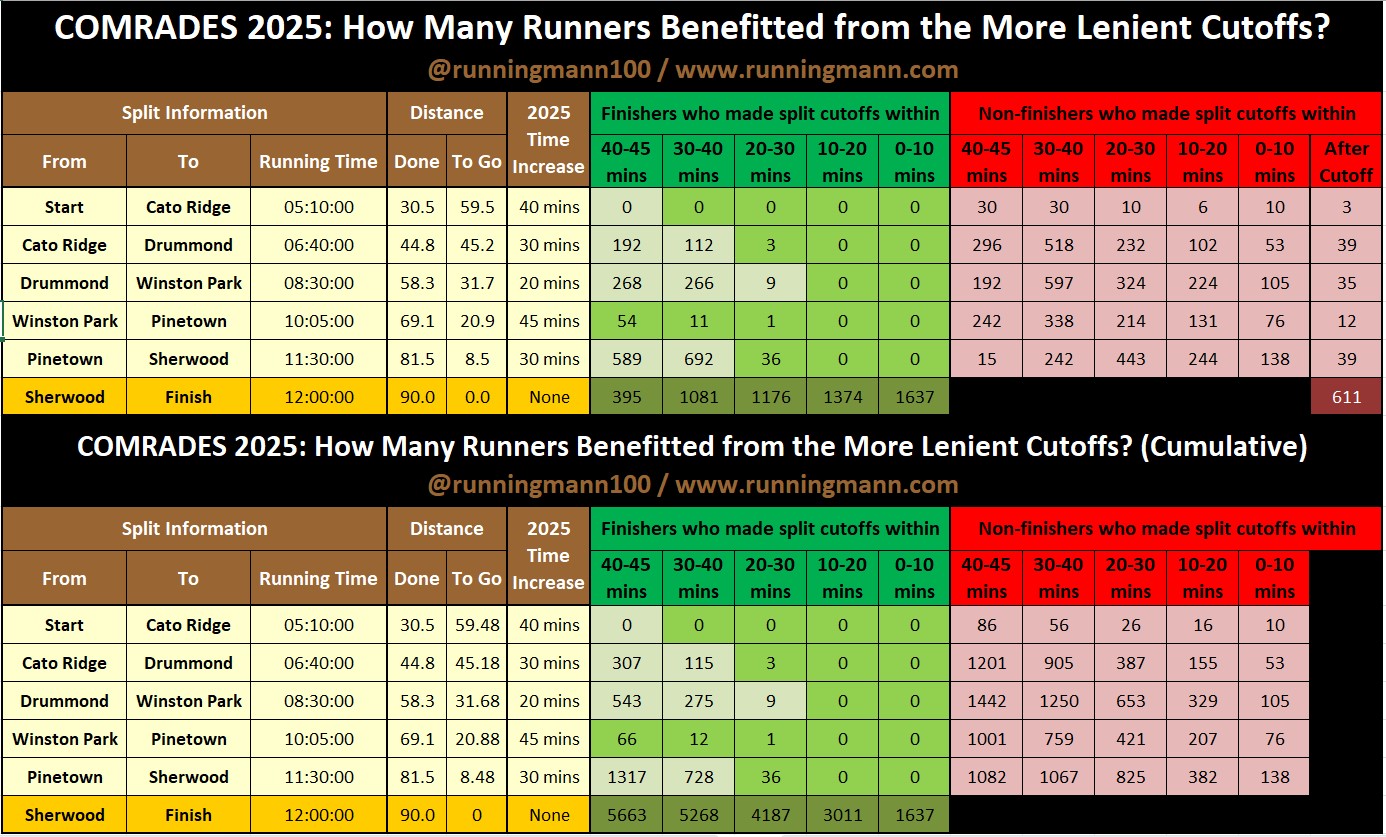
The last down run in 2023 was marred by the cutoff debacle that saw several hundred would be medallists pulled off the road at Pinetown and Sherwood. The 2023 run was also 2.2km shorter than the 2025 route. At the back of the pack this equates to 15 to 20 minutes of running time. At the Sherwood cutoff alone just 15 minutes would have impacted 1,281 runners. This also highlights that should we have another ‘short’ Comrades in the future, the later cutoffs need to be scrutinised.
No one who made any cutoff by less than 20 minutes earned a medal. This raises the question, “Are the cutoffs now too lenient?” Here the statistically correct answer is “Yes” but the analytical answer is not as clear. Cutoffs are not there for pacing or medical reasons; they are there for the sole reason to open the roads again to regular traffic. Unless there is pressure from the city or residents, I would always err on the side of caution with cutoffs – rather too lax than too strict.
Of specific interest are the three people that went through Drummond over 6h10 and a further 112 over 6h00 and earned a medal. This is not something I’ve seen before. Of the three, the slowest was Nangolo Ashipala from Windhoek in 6:11:47 – I’ve done a separate article on his amazing 11:59:38 finish (see link below). The other two are Riaan de Villiers from Durbanville AC and Udaysinh Ghorpade from India – I’d love to hear about their runs if anyone knows them.
READ MORE: Comrades 2025 Runner Stories: A 24 minute negative split for an 11:59:38 finish
Note: The dark green line at the bottom are the medallists who finish with 10 minutes of cutoff, etc. So there are 1637 Vic Claphams who finish with 10 minutes or less to spare and a combined total of 5663 who finish in the last 45 minutes.
Time Waits for no Man (or Woman)
The best time to run the Comrades Up run is in your early 30s. The 31-35 year old cohort has both the best finish rate and fastest average time. After that it’s an “uphill” battle! This stat has been consistent every year – although the 26-30 cohort come close to upsetting the pattern in 2025.
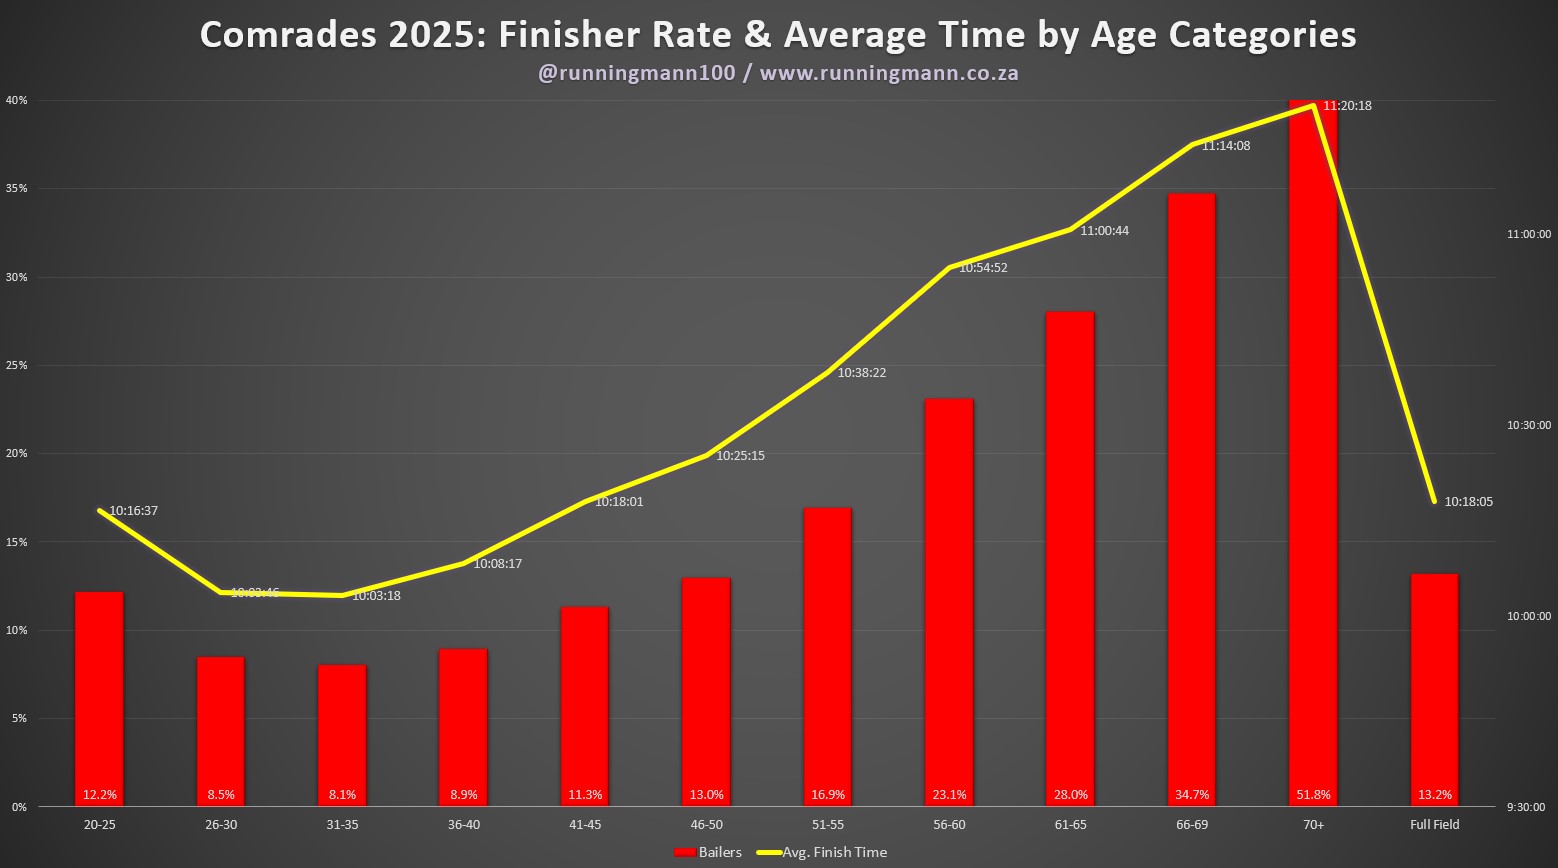
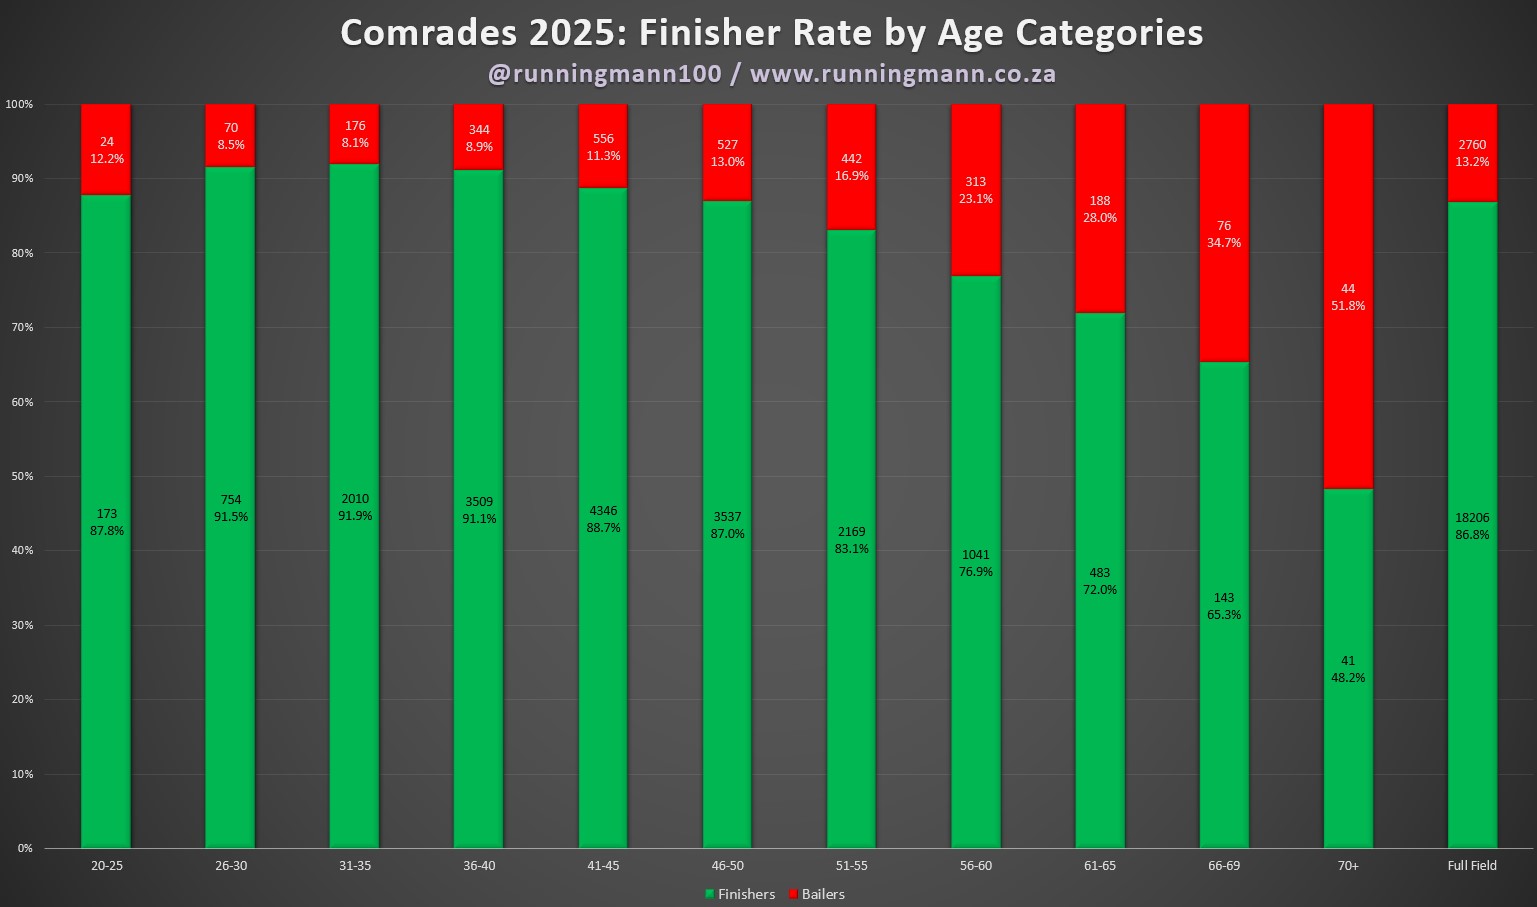
Also consistent with previous years is that anyone below 50 years old beats the “full field” finish rate but you need to be under 45 to beat the overall average finish time. There’s a big deterioration in both finish time and success from 60. More than 1 in 4 in the 61-65 group fails to finish and this jumps to over 1 in 3 in the 66-69 group and 1 in 2 for those over 70.
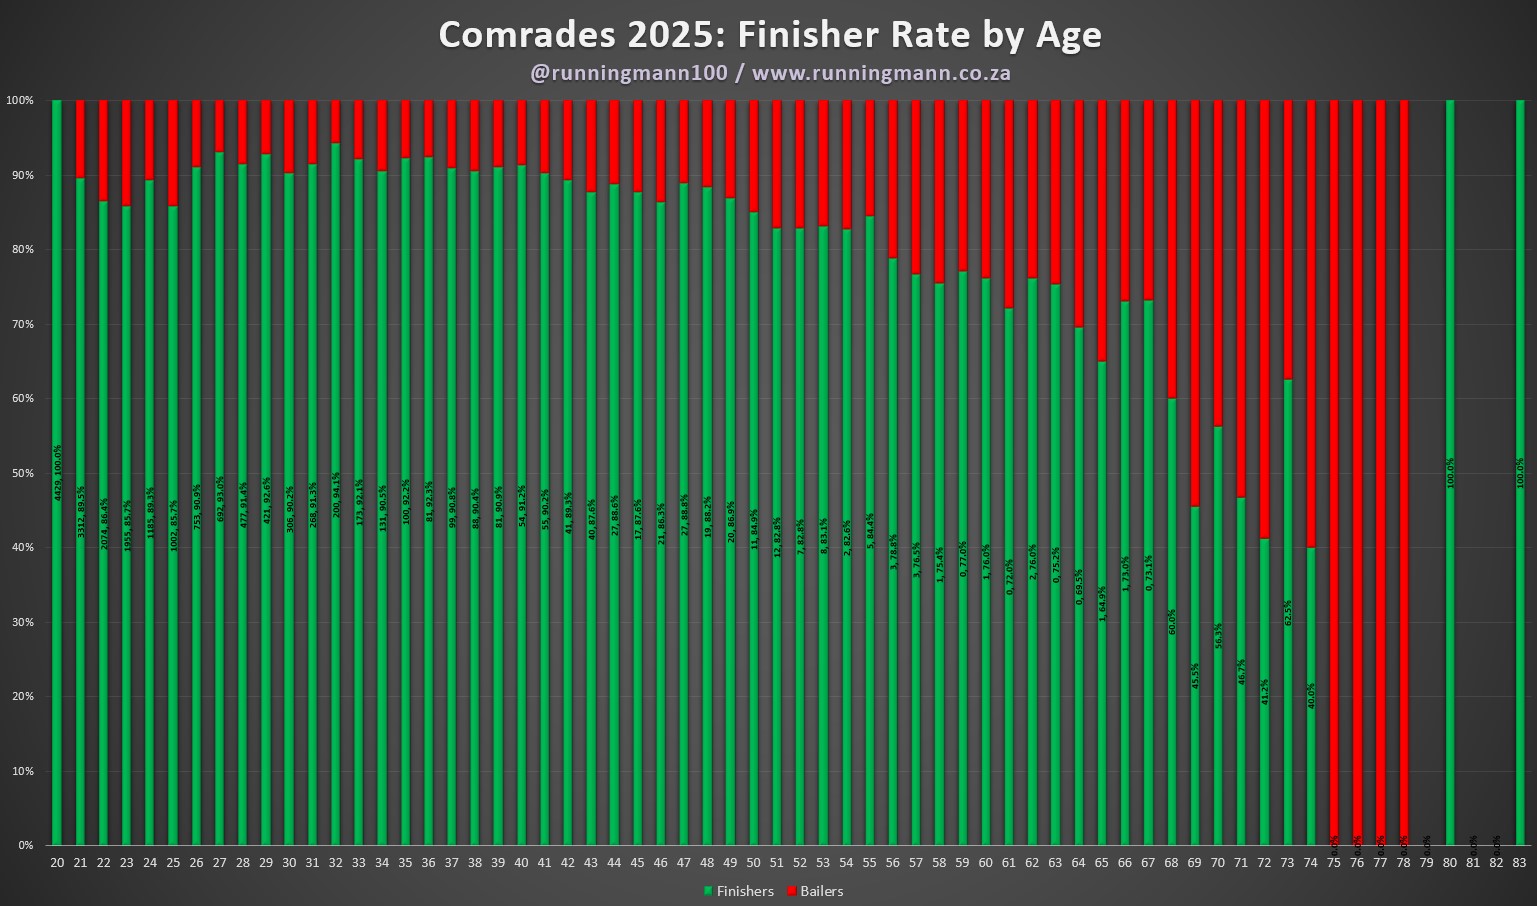
An uncategorised view is also provided. All nine 20 years olds that started finished. You can also see just how rare it is for over 75s to finish Comrades. There were just two this year: 80 year old Mark Headbush and 83 year old Johannes Marosi Mosehla.

Using the criterion of 50 starters or more, the best ages by finish rate are 32, 27 and 29 (in that order) and for time 26, 35 and 30. The number prefixing the average finish time is the finishers for that age. Other than the very old and very young at the fringes, the numbers for each age are large enough to be statistically relevant.
The other bar graphs provide a simpler finish rate view by age groupings and individual ages. The table provides a summary of the source information as well as time and success rates by gender.

Should you Stick with a Green Number?
Conventional wisdom has it that if you want to succeed at Comrades you should stick with a Green Number runner on race day. Does the data agree?
When it comes to colour coded rules to live by in winter you should never eat the yellow snow but following a yellow number at Comrades is OK. However, you blindly follow a Green Number at your own risk.

The overall success rate of the Comrades class of 2025 was 86.8%. The only cohort that rises above 90% are those with 5-8 medals and only two others beat the average – milestone runners going for Green, Double Green, Triple Green and Louis Massyn are second with 89.1% and those with 1-4 medals third with 88.9%.
Green Numbers with 10 to 18 finishes are only slightly more successful than novices. By far the lowest success rate are Double and Triple Greens. However, this is to be expected as age has a significant impact on finish rate (see age stats section). Darwinian ‘survival of the fittest’ mentality seems to prevail as almost all those who started with 35 or more finishes add another medal to their collection.
The single best performing medal group with 10 or more starters are those with 6 medals (92.7%) followed by those with 7 and 3 medals (both 90.5%). Those running in a Yellow Number hoping to turn it Green are the only other group with a success rate above 90%. The worst performing group with a sample size of 100 or more runners are those who started with 16 medals (75.7%) followed by 18 (77.9%) and novices (82.2%).

The table provides a summary of the source information as well as time and success rates by gender.

Fastest by Age
Silvers for under 25s are very rare, just 6 earned for 25 and unders this year, and 20-year-old Johan Stoltz is the only recipient under 24. The first Wally is earned by anther debutant, George Kusche, who had a great first run to finish 12th. Kusche was behind the fastest 33-year-old, Aleksei Beresnev, who finished 11th for the second year in a row. Piet Wiersma is the youngest gold at just 27.

The oldest Wally in 2025 belongs to Entsika’s Solicitor Manduwa at 50 years young. Silver 60s are also very rare (the all time list is in the low teens) but two new names are added this year: Nimrod Mokoena (62) and Richard Lee (64). Lee’s is one of the oldest silvers ever (Callie Beneke was 66 when he ran 7:23:32 in 2003 and Carel van Wyk ran 3 silver 60s, the last was 7:13:36 in 1999 at 64).

There were just 8 men of 75 and older who started and just 2 of them finished, Johannes Marosi Mosehla (breaking his own record and the outlier at 83) and Mark Headbush (80). Headbush becomes just the third octogenarian to finish Comrades after Mosehla and the great Wally Hayward. Headbush has his son, Jimmy, to blame. Jimmy was running his 10th and convinced his dad and 11 other family members to join him on his Green Number run.
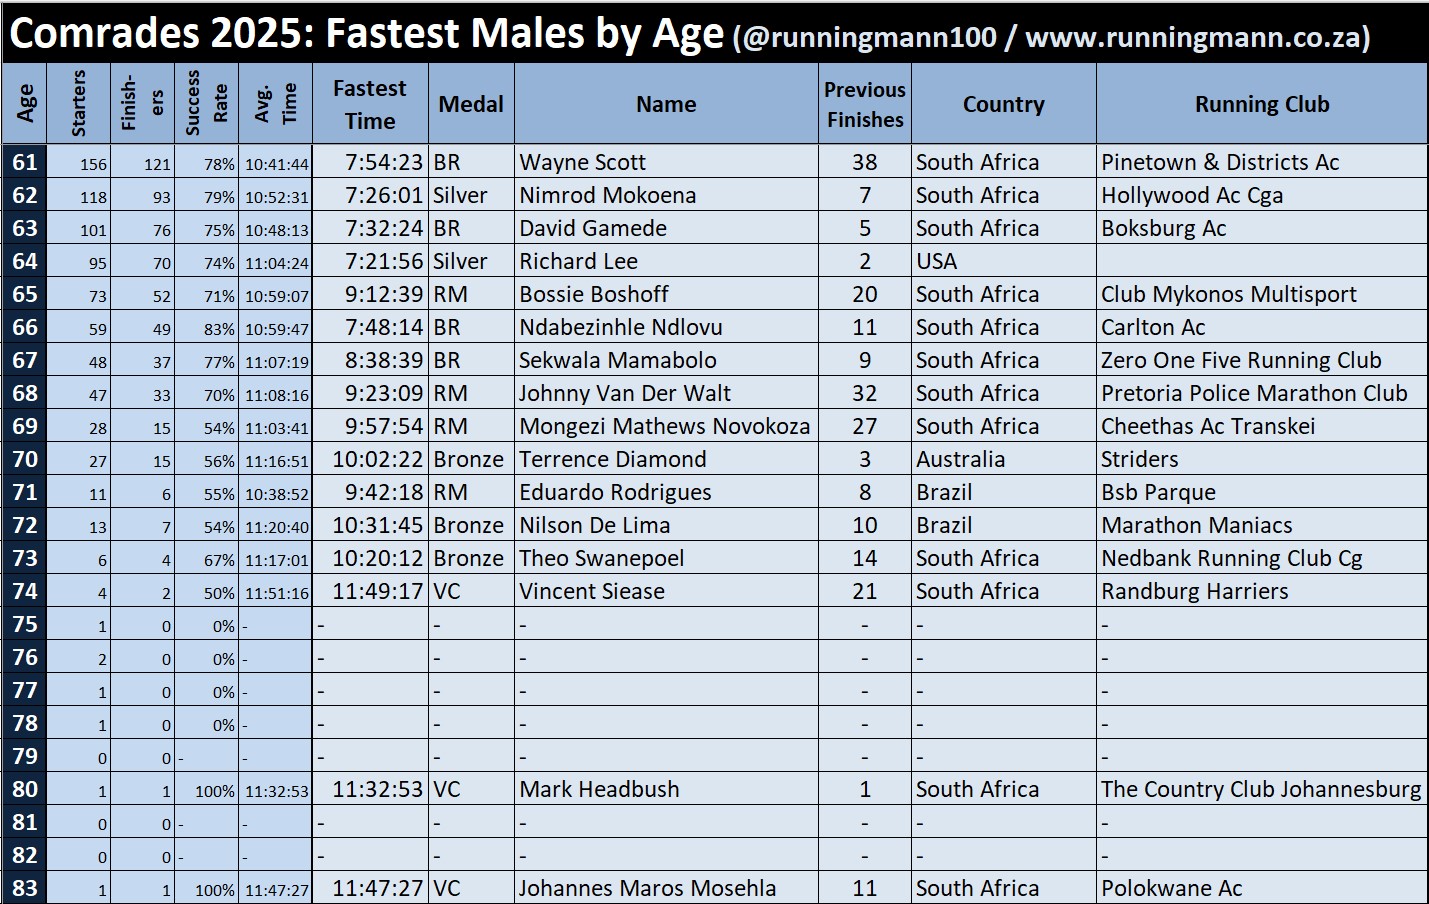
When it comes to Comrades running, men seem to mature faster. The first lady to earn a silver is 27-year-old Carla Johnson and the first Isavel Roche-Kelly goes to Zambian Elizabeth Mukoloma (28) who was the early race leader. Melinda Jansen Van Vuuren earns bragging rights from her twin sister, Melissa, to round off the under 30s.

Jenet Mbhele makes it 3 golds from 3 starts and is the youngest top 10 finisher at 30. The ‘golden oldie’ is Caitriona Jennings (44). Helena Joubert (49) scores the last IRK and the UK’s Sarah Swinhoe (54) is by far the oldest silver medallist. I need to verify but I think both of these may be ‘oldest ever’ records.

On the tail end, we had 11 ladies of 70 and older starting this year with 5 finishing. Rather appropriately, the oldest runs for Old Edwardians AC: Linda Icely with her 24th finish. Sadly Petra Myburgh was not able to extend her own record as the oldest female finisher from 74.6 to 76.6. Australian Jennifer Kellett smashed the female 70+ record with a 9:29:14 (you have to go back 10 years before find a younger women with a faster time in 2025) and she also beat all the 70+ men.

Youngest Finishers
At just 20 years and 6 days old, Xander McNeil from Dolphin Coast Striders was the youngest finisher at Comrades 2025. Michael Herholdt running for Maties was the youngest back-to-back medallist and the youngest runner to earn a silver medal was local Getfit AC runner Johan Stolz with an impressive 7:22:02.

On the ladies’ side, Minkateko Letsoalo in the colours of Nedbank Gauteng North, was the only under-21 and finished with a comfortable bronze medal. At 21.7, Angy McColl, running to raise money for the Viljoenskroon Old Age Home, was the youngest back-to-back female medallist (and her dad, Stuart, completed his 21st). It must have been a special day for the mother and daughter team of Liesel and Inke Janse van Rensburg who ran the entire race together for Inke’s back-to-back and Liesel’s Green Number medal.
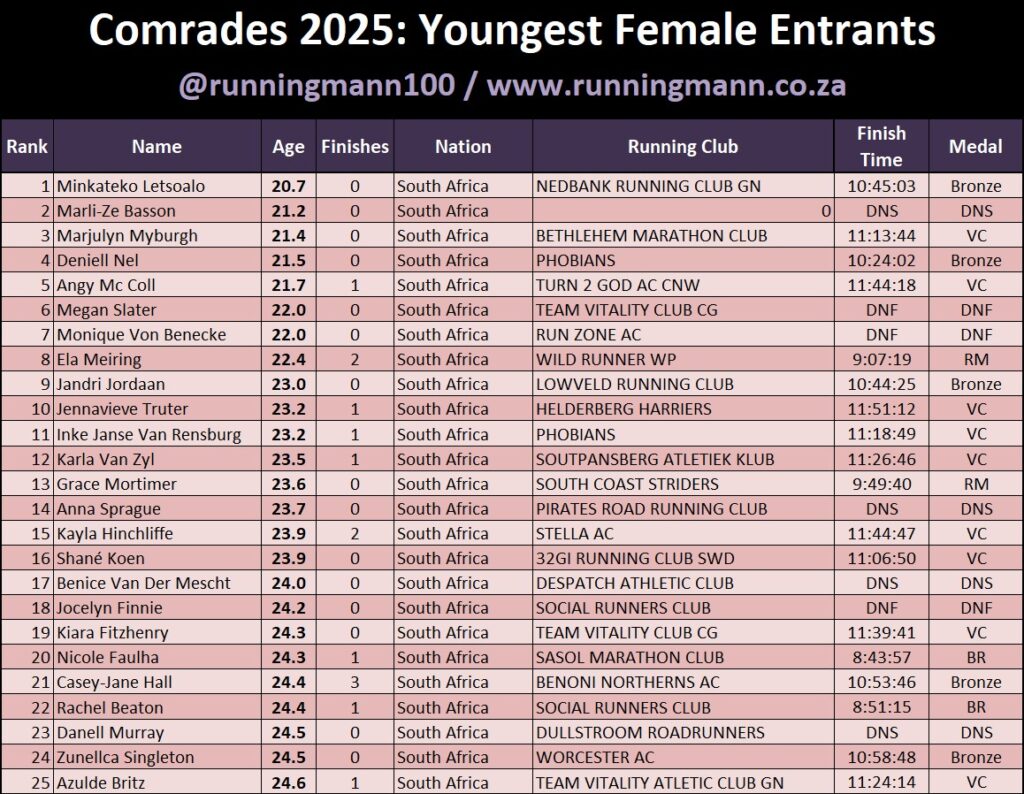
Fastest on the ladies list was Nicole Faulha from Sasol Marathon Club who secured a second consecutive Bill Rowan with a 8:43:57 finish.
Oldest Finishers
Anyone who thinks that Comrades is an old man’s race should avoid looking at the chart of the 25 oldest male entrants at Comrades 2025: only 4 of the oldest 25 managed to complete the race this year (15 DNS / 6 DNF).
Leon van Wyk, a wonderful gentleman who makes beautiful Comrades clocks (many of which he gives away for free), was the oldest entrant but sadly getting knocked over by a car while running a few years ago seems to have ended his Comrades career. Johannes Maros Mosehla adds another digit to the “oldest ever” Comrades finisher but kudos must go to Mark Headbush who becomes just the third person over 80 to complete Comrades (the other is of course the great Wally Hayward). Headbush was part of a family group of 12 Headbushes that tackled the Comrades this year to celebrate his son Jimmy’s Green Number.
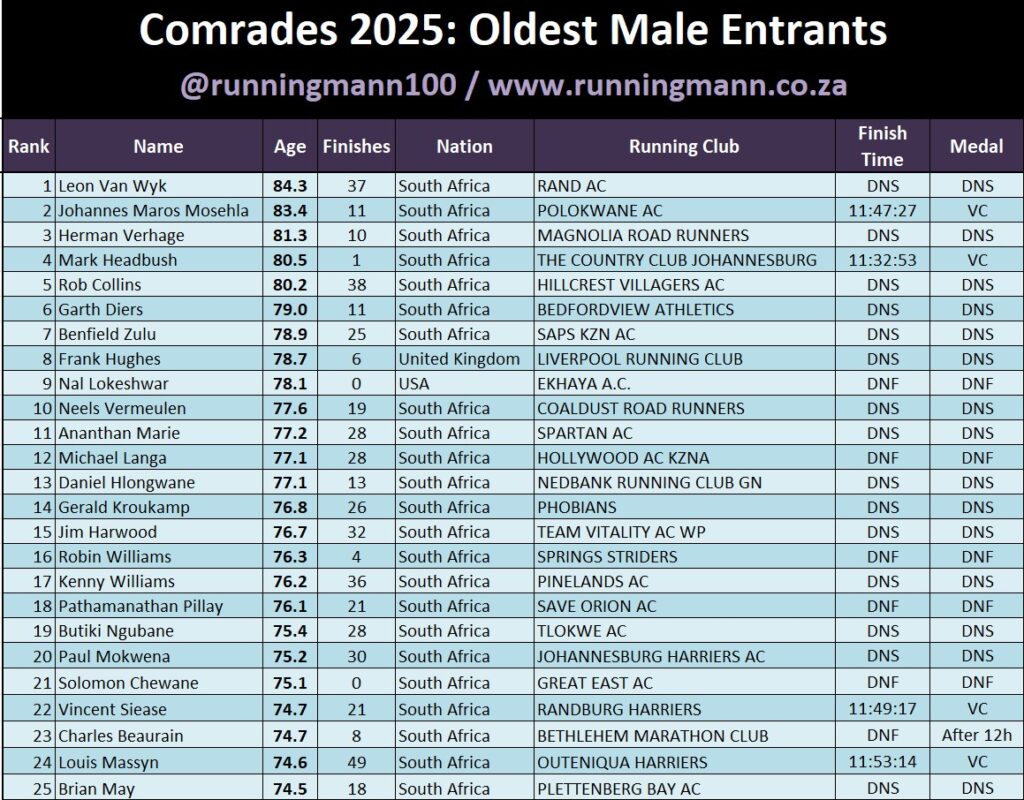
Randburg Harriers’ Vincent Siease is third oldest with his 22nd run but the superstar on the list is Louis Massyn with the incredible of achievement of his 50th Comrades medal. Barry Holland is hoping to have a second crack at #50 in 2027, Vic Boston is on 47 and Wietsche van der Westhuizen is on 46 so hopefully we’ll see some more 50th drama in years to come.

Seven of the oldest 25 ladies earn a medal (there were 8 DNSs and 10 DNFs). At 73.1, the oldest female finisher in 2025 is the evergreen Linda Icely who, rather appropriately, runs for Old Eds. This was her 24th finish. The only other South African on the list to finish was Polokwane AC’s Mboneni Maumela.

Petra Myburgh is the only women ever to have finished Comrades over the age of 74. She last ran in 2023 but missed 2024 and sadly was not able to extend her record this year. She went the distance but crossed the line about 45 minutes after the cutoff. According to her son Charl, she’ll be back in for another shot at the extending the record as well as her 25th finish in 2026.
The absolute outlier on this list is Jennifer Kellett. She’s Australian but trains under the Fordyce Fusion banner. Kellett smashed the female 70+ record with a 9:29:14 (no other women within 10 years of her finished faster). Kellett also beat all the 70+ men. I had a chat to her coach, Iain Morshead, yesterday. Iain mentioned that a few weeks after Comrades, Kellett ran the Gold Coast 5km (24:06) and half marathon (1:41:33) on Saturday and then the Gold Coast Marathon (3:57:42) on the Sunday. Although she set event age group records on all distances, Iain was quick to point out that she ran at an “easy pace” (her marathon PB is 3:23 from Chicago 2024).

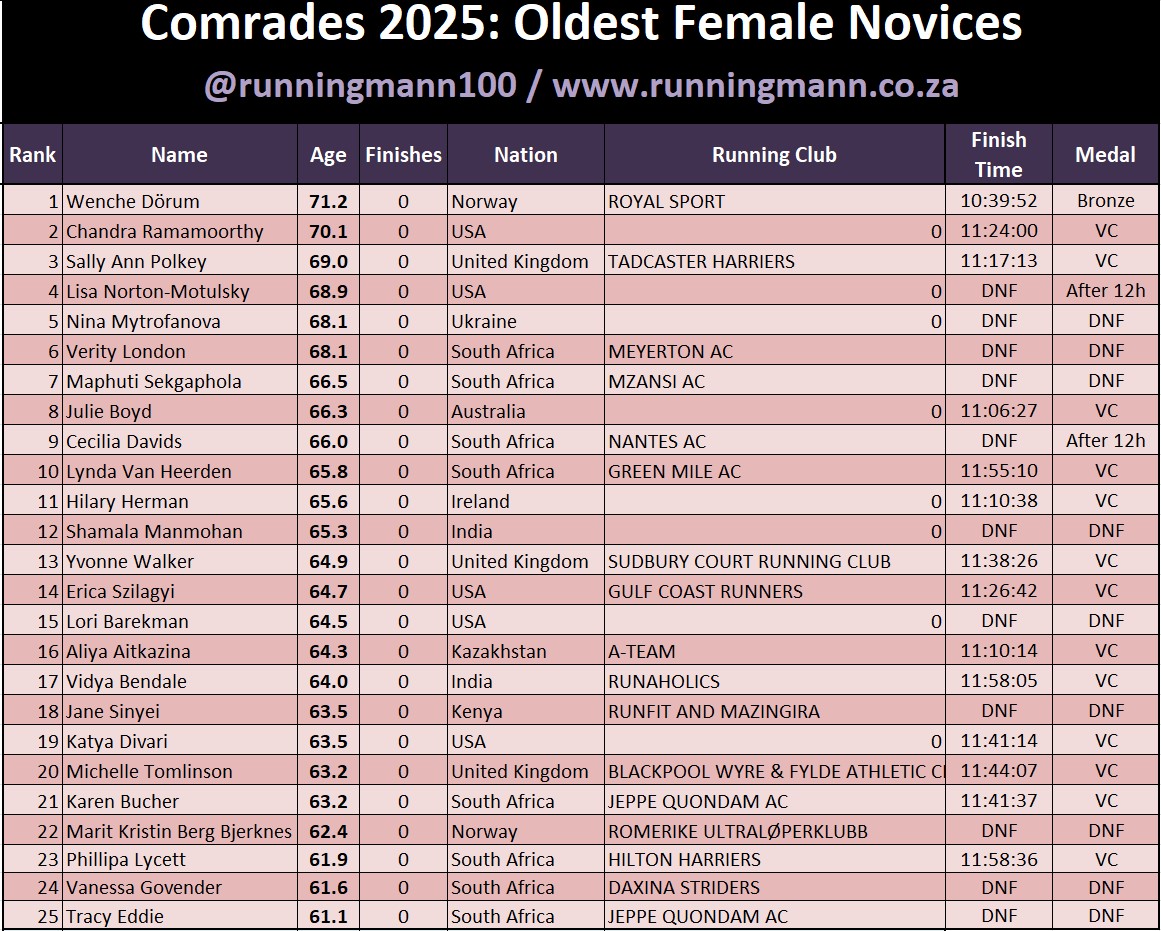
Oldest Novices
This year’s oldest novices lists produces a very interesting result. The Norwegian husband and wife team of Lars and Wenche Dørum (both 71) top the charts. Lars’ performance was a standout 9:45:28 whilst Wenche did an equally impressive 10:39:52. Only 12 of the male and 14 of the oldest 25 female novices managed to get a medal.
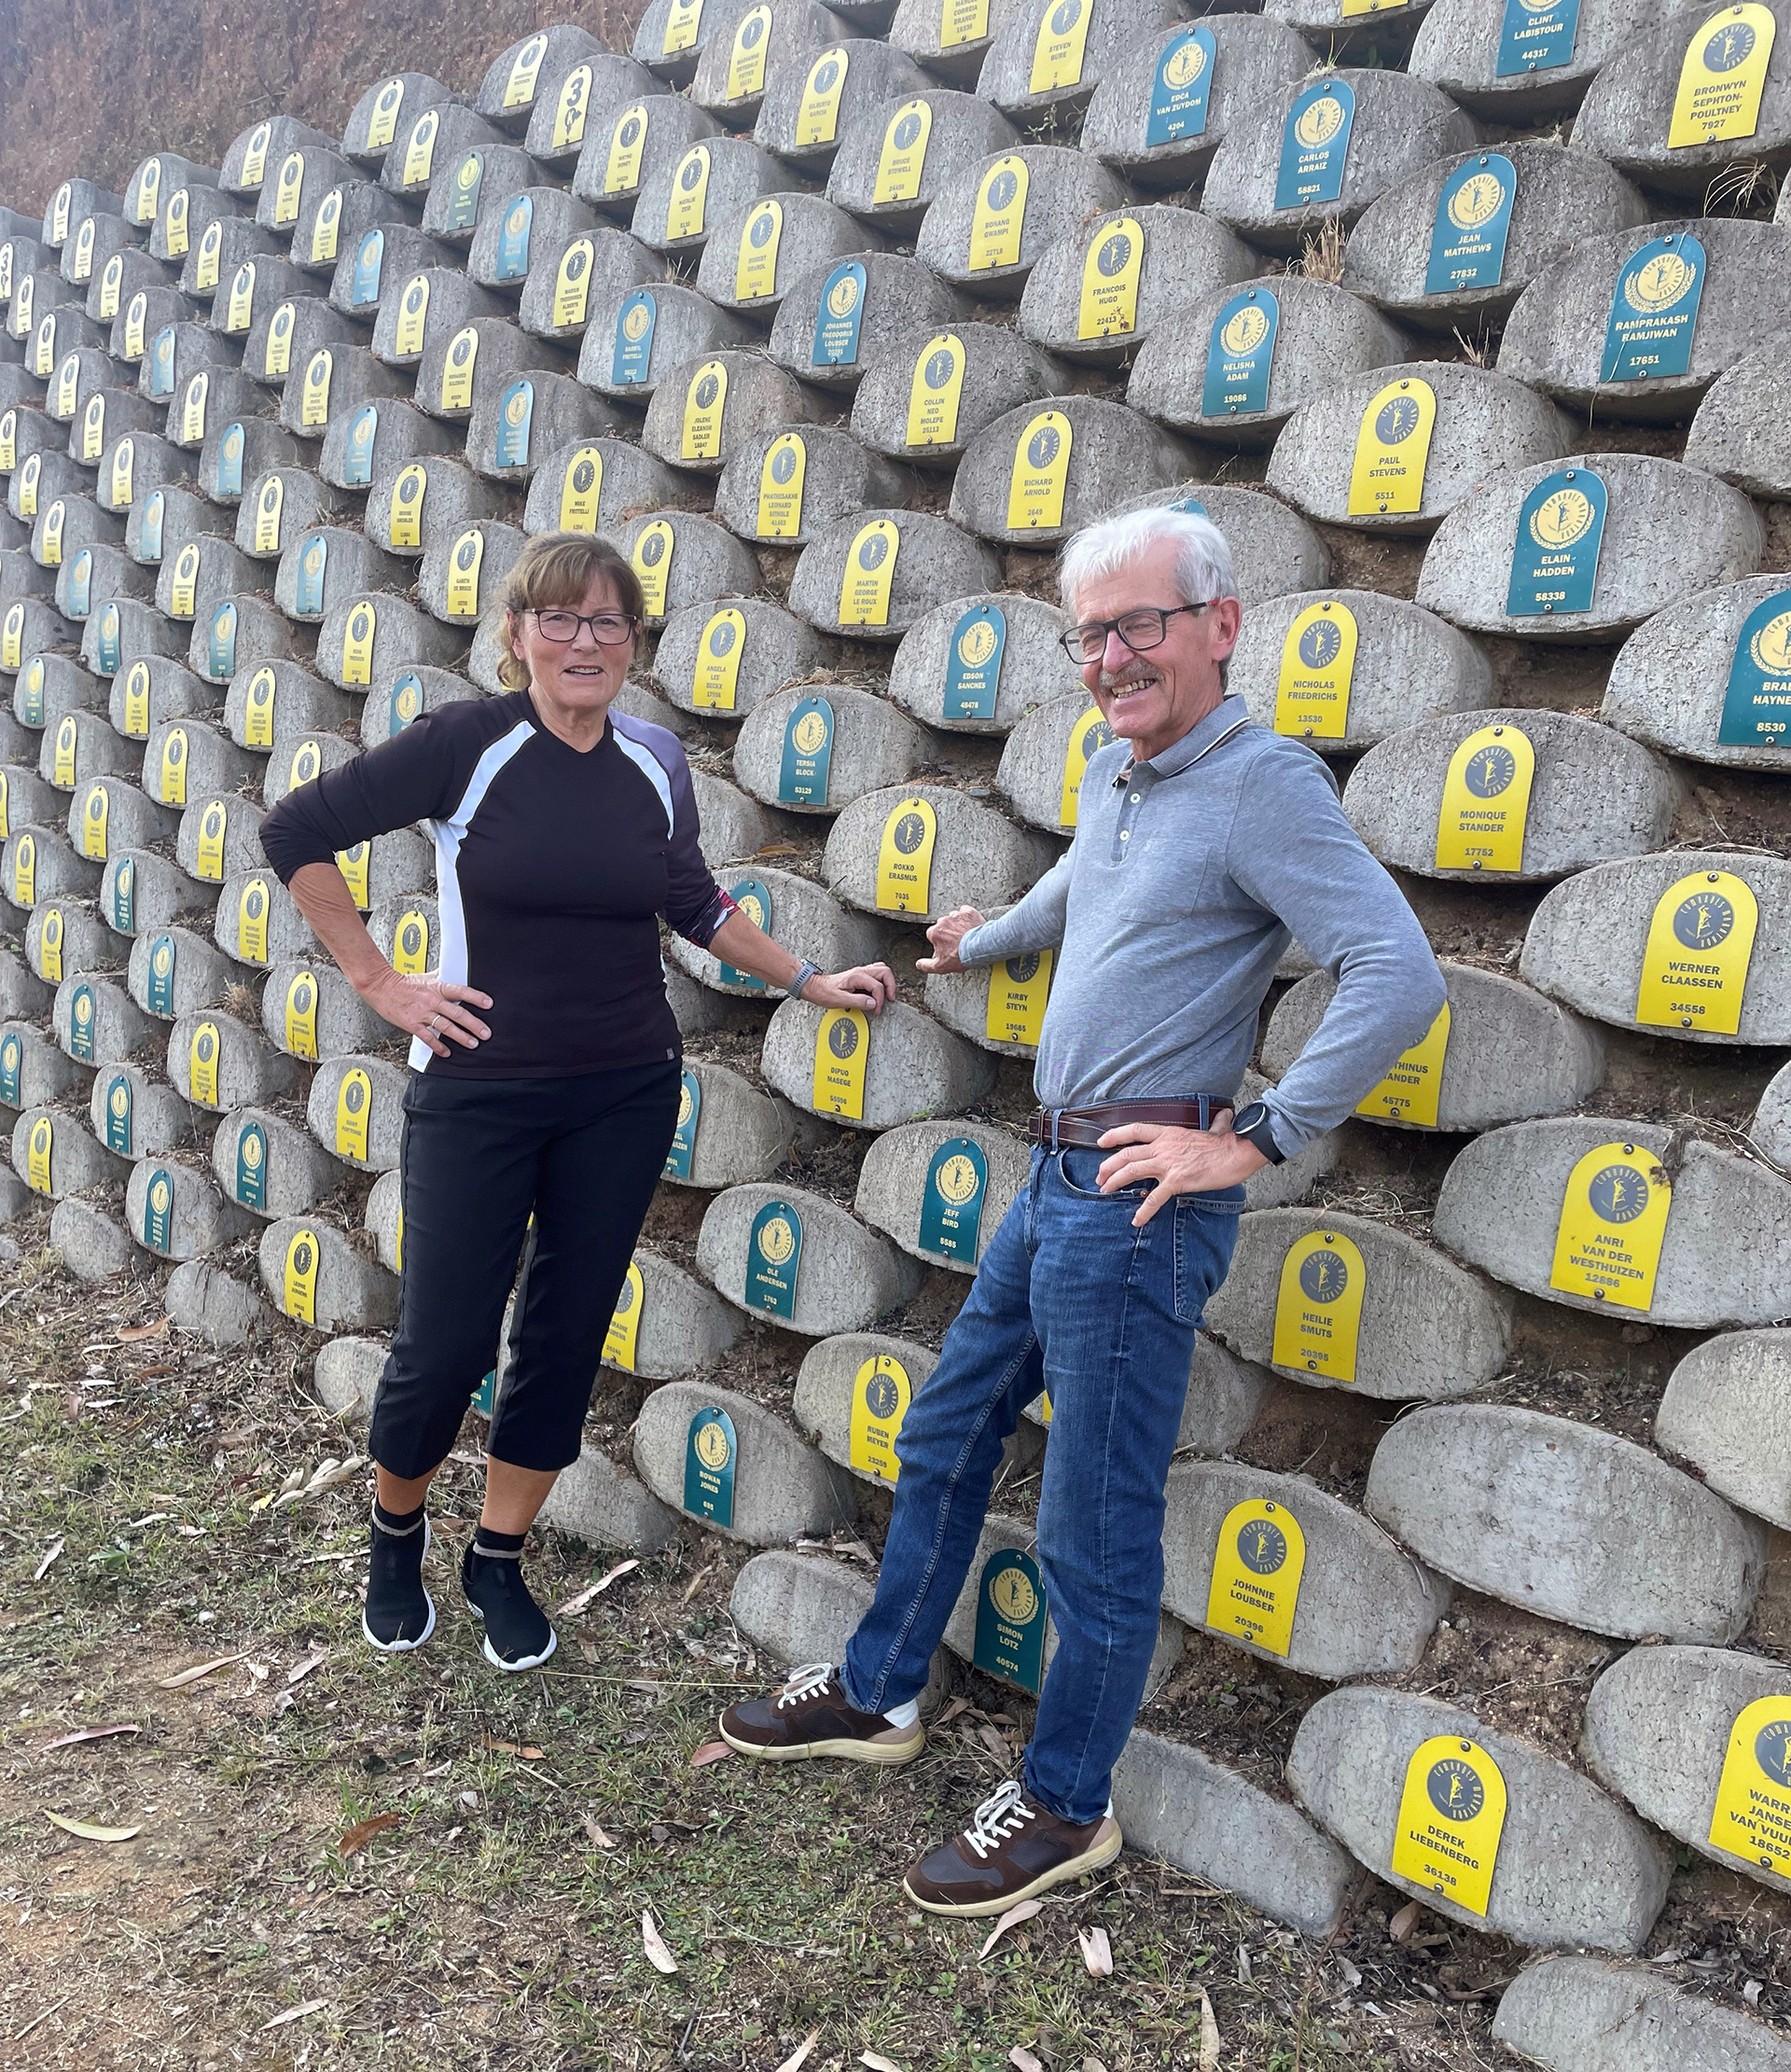
Lars has apparently earned the nickname “evighetsmaskin” (eternal machine) and has completed many seriously long ultras that make Comrades look like a parkrun including the 246km Spartathlon in Greece several times. Lars was still running sub-3 marathons until just before his 60th birthday. Likewise, Wenche has many ultra marathon age group records and titles to her name.

Negative Splits (& Pace)
All coaches promote negative splits at Comrades but how many athletes can execute it? The answer is just 4.6% of the medallists (finishers) and an even 4% of starters.
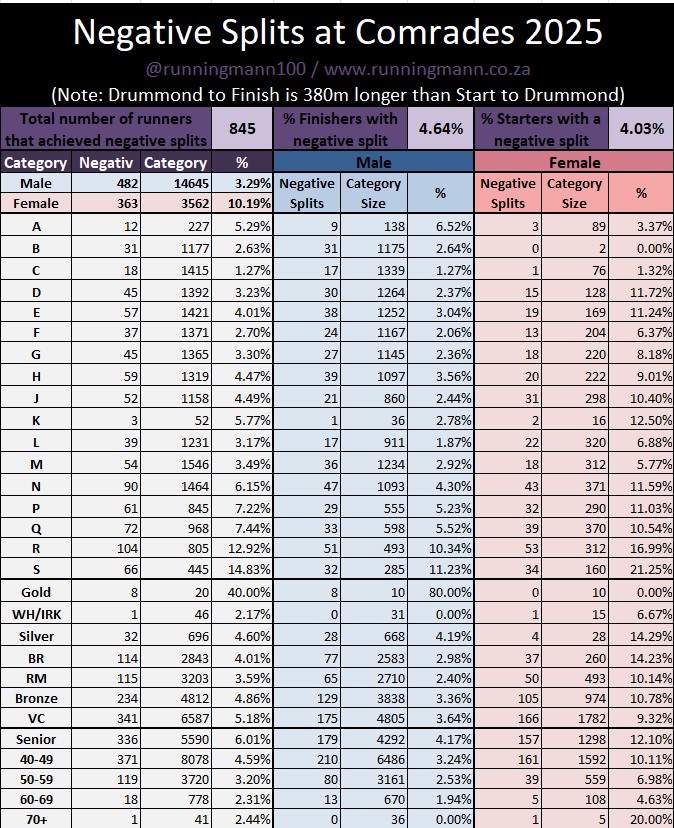
As expected, females fare much better than their male counterparts (10.2% vs 3.3%). The negative split percentage increases as one goes up the seeding batches with an impressive 21.3% of S batch ladies achieving a negative split.
Segmenting by medal earned, in the past one normally saw that slower medals had a higher negative split count. This year it is more evenly balanced. The one notable exception is the male golds where all of the Top 8 all achieve a negative split (usually it is just positions 1 and 2) and the female golds where no one earns a negative split. See the separate articles on elite men and women for more details.
When segmenting by age, it’s the youngsters who achieve the best negative split rate and the rate gradually declines from there. So much for wise old heads…
The distance from the Drummond timing mat to the finish meant that the second ‘half’ was 380m longer resulting in negative pace increasing to over 6% of finishers and 5.5% of starters. The equivalent figures in 2023 were 7.1% and 6.6%. The biggest factor impacting the drop is likely the two pot start system resulting in most runners crossing the start line faster and therefore having less of a ‘handicap’ on the first half.

Biggest Negative & Positive Splits
You needed a negative split of 22 minutes to make the Top 30 this year. Nedbank score another victory at Comrades 2025 with Sondelani Nzama’s 46m43 topping the chart (he’s also the only person to run a minute per kilometre faster from Drummond). Paula Dovey from Westville is the only Green Number on the chart whilst Runzone’s Jenna Bennett gets her Green Number in style running the second half almost 30 minutes faster.
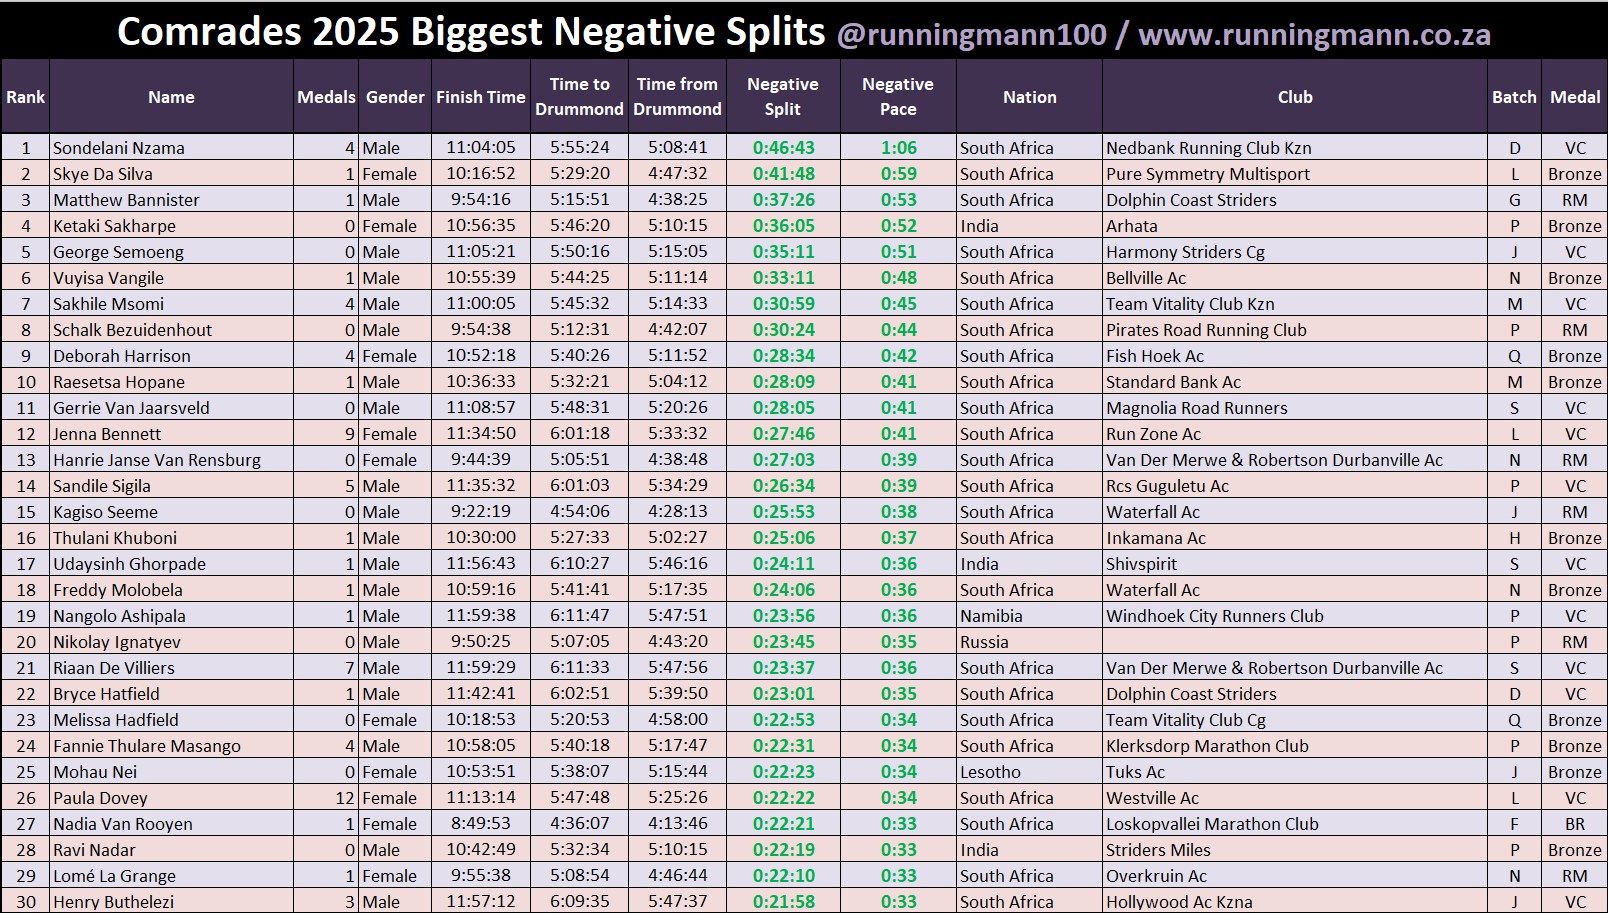
An interesting name on the list is Schalk Bezuidenhout in 8th. He appears to have lost his sense of humour in Inchanga but found it again over the second half for a solid Robert Mtshali. The only Bill Rowan or better on the list is Nadia van Rooyen in 27th.
In previous years there have just been one or two people that went through Drummond and earned a medal but there are 6 on this list alone. The slowest to halfway was Nangolo Ashipala from Windhoek in 6:11:47. From there he cracks a 23m56 negative split to finish with 22 seconds to spare.
Note: I have removed one obvious case of cheating (a supposed 2h30 negative split with all the second half splits missing).
On the other side of the table there is the positive split list. In my opinion, these are the true heroes of Comrades. To hang in there when it’s not your day and lesser men and women would have called it quits is what Comrades is all about. There are always some great stories to share from people on this list (and these are the races that people tend to talk about forever).

When I saw elite runner Chrizell Roberts post, “Toughest day ever. I can only sum it up by saying, I believe I started a tad too quick. Was projectile vomiting by 40. Got assistance slept for an hour, felt better and decided to keep running.” I told her she might be appearing on my stats list. Sure enough Chrizell tops the positive split chart.

I broke the good news that’s she’d “won” the biggest positive split at Comrades 2025 by 2m22 (from second placed Itumeleng Phala) and asked her for a comment. Here it is…
“So glad I won something!! 😂 I try to be positive in every aspect of my life, and it seems to be just as true when it comes to my comrades’ splits! Looking on the positive side, I’m pretty sure things can only improve from here 🤭
Just want to share with you…
It was actually such a special moment, sitting alone on that bailers bus at 53km, having a much needed rest, feeling very deflated and sorry for myself…. another lady, going for her 10th Comrades, said a tearful goodbye to her husband whom she was running with… she joined me on the bus, looking just as terrible as I did an hour before. All she wanted was to give up and lie down. After another 10 minutes, I came to the realization that I actually felt amazingly better. I asked the Comrades official if I may continue… shocked, he asked; “You want to run?” I said yes, and within an instant, the other lady sat up, looked me dead in the eye, and asked? “Are you going to continue with the race!?!”
I said yes, are you coming with me? Without any doubt, she said; “Yes! Let me just tie my shoelaces.”
We got off the bus, I reattached my race bib, started my watch, and off we went. We didn’t stay together long, as I realized that I’m group 1 and she is group 2… we made a promise to one another that we are going to push through to the end. And so we did. I looked her up… Annalisa Freese. She missed her medal, which is sad, but I was still so proud of her and myself for not giving up again. So, even though this was my worst, this Comrades holds such a special place in my heart. My heart is full.”
It just goes to show that the stories are always much more interesting than the stats! I am sure that Chrizell will be back at the front of the field next year and Annalisa Freese (who went the distance but cross the line after the 12 hour cutoff) will be getting her Green Number in 2026.
I am sure that there are some more stories from people on this list – if you have one to share please let me know!
Even Pacing
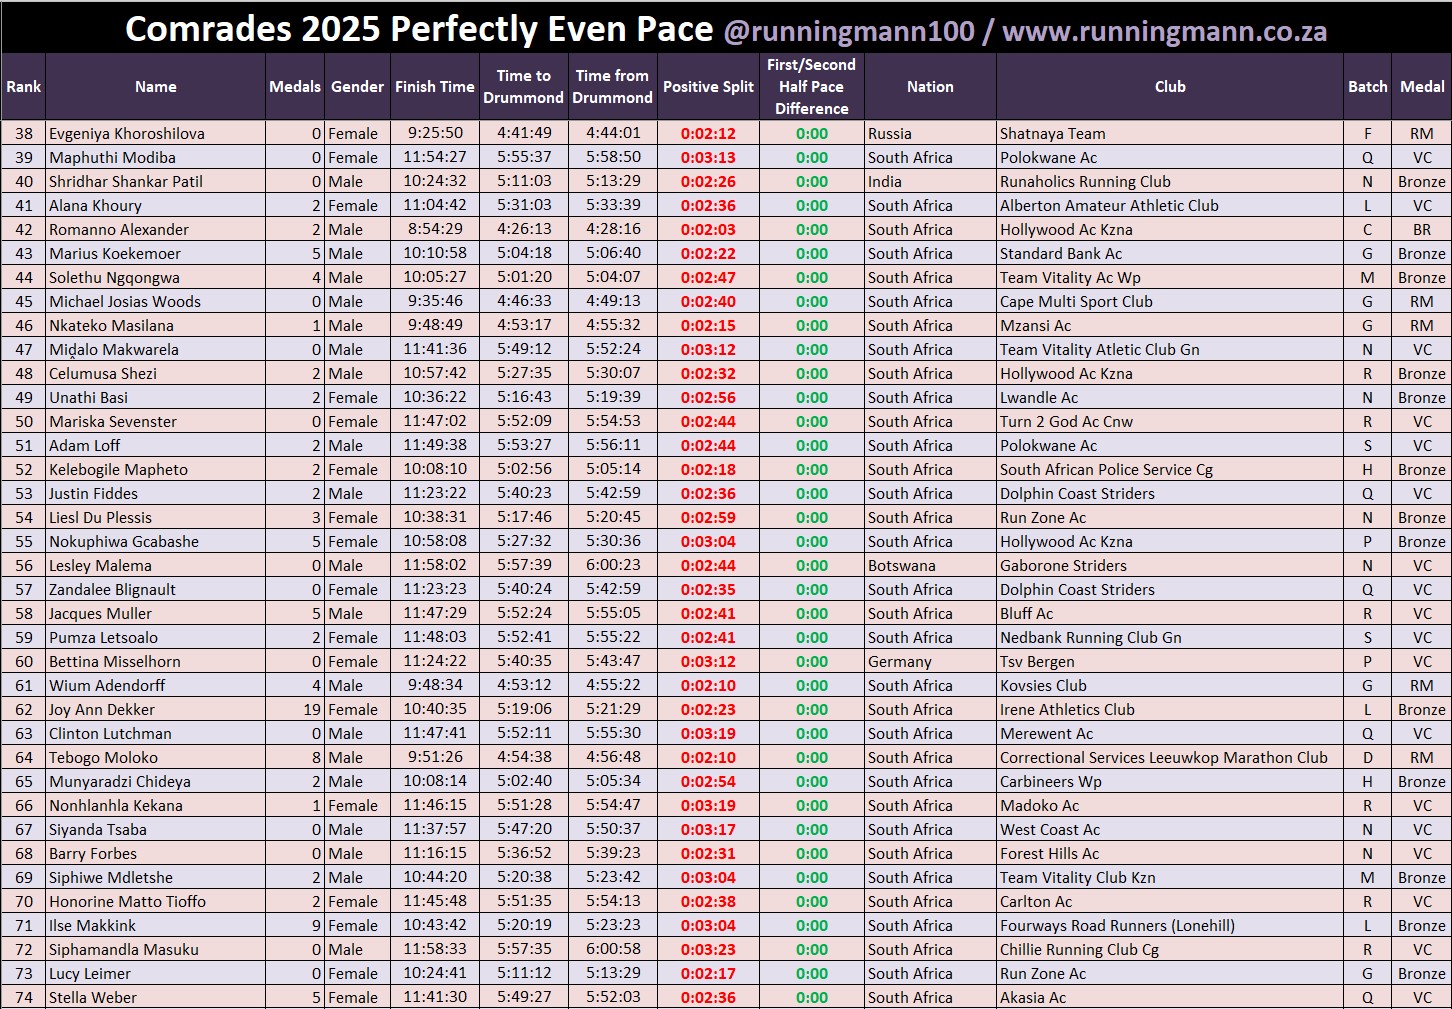
By request here are tables with the top 30 narrowest negative and positive splits and the surprisingly large list of 74 runners who ran the first and second half at a symmetrical pace. Interestingly, there were also seven runners who ran an even pace but finished after the 12 hour cutoff.


Split Happens
Here are the biggest negative and positive splits by medal, batch and age group. As stated previously, both sides of the table deserve plaudits – and those on the positive table are more likely to have an interesting story to tell (and I’m all ears if anyone is sharing!).
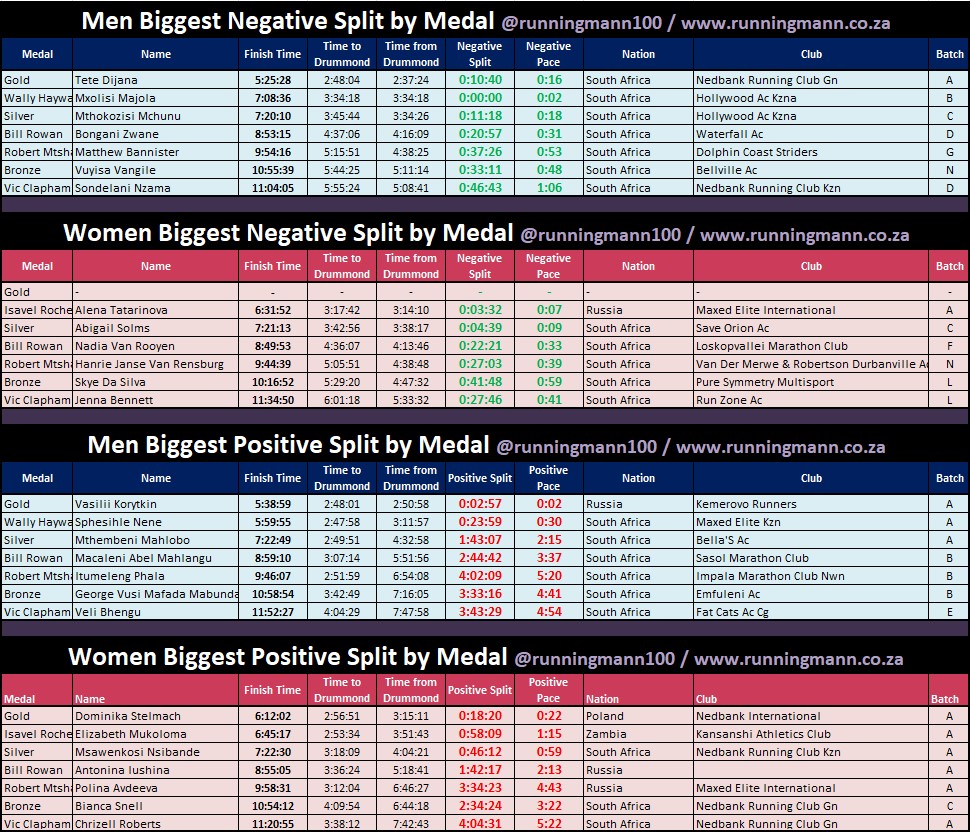
This is the first year since I’ve been doing these stats that no female gold medal winner earns a negative split. Conversely, there are many years where none of the gold men manage this feat but all Top 8 achieve a negative split in 2025 with the largest going to race winner Tete Dijana (a 10m40 negative split is also the biggest I’ve seen in men’s gold).


The biggest positive split from A batch is earned by Ben MacCronan who has a the roughest day out in South African for an Australian since Mick Lewis at the Wanderers on March 12 2006. Interestingly, there are several positive and negative splitters who finish in the last couple of minutes before the final 12 hour cutoff.
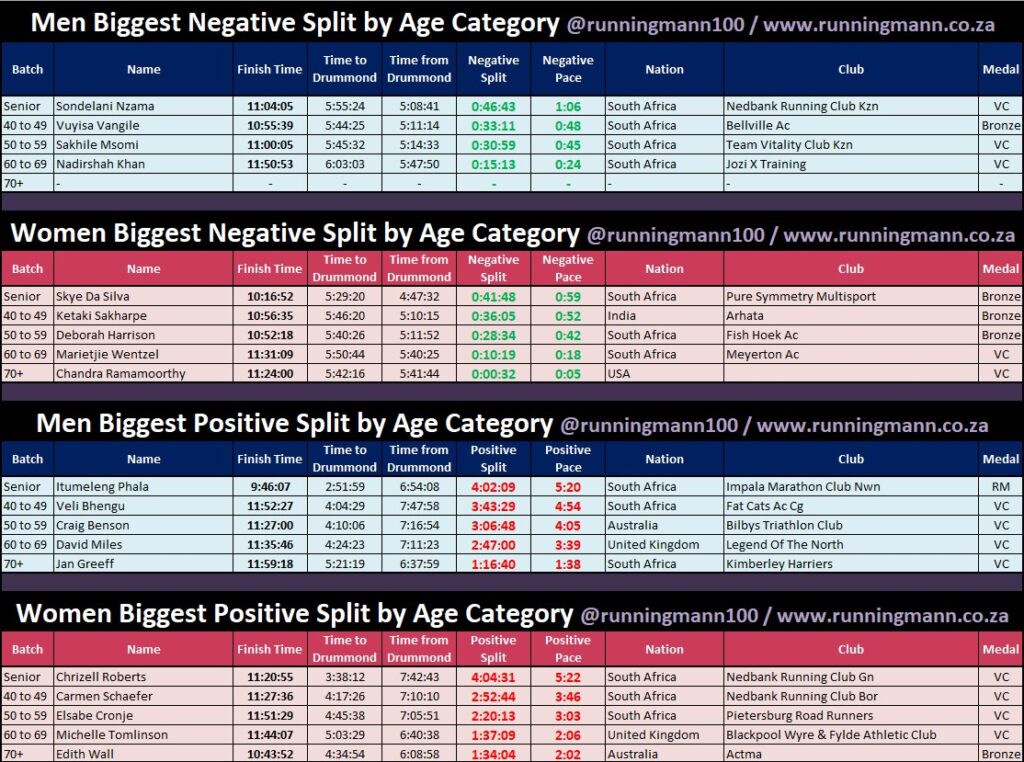
Know Your Split
When looking at the fastest split stats two things are clear:
- There was a lot less congestion this year with the two-pot start system.
- Most people ignore expert advice and common sense and blast out the gates.

Over a third of the field (36%) run the first 5km as their fastest pace of the day. A further 12% achieve maximum velocity before dropping down Polly Shortts and 11% hit the highest point of the route at Umlaas Road at top speed. That’s 59% of the field who run their fastest split over the first three splits. Bruce Fordyce’s “Start like a coward and finish like a hero” mantra is completely disregarded by the majority. Only a third of the field run their fastest split over the much easier second half.
However, 31% of the field run the penultimate split from Sherwood to 86km as their fastest. Here there is a big difference between men (26%) and women (51%) achieving their best pace over this split. Not that any more evidence is needed, but this is further indication that women pace Comrades far better than men.
Runners have a right to complain about Botha’s Hill. Not one runner managed to run this as their fastest split. For future reference, anyone wanting to get onto my stats list can set this as a challenge. The Westville to Sherwood split also proves a tough customer with just four runners recording this as their fastest split: Sifiso Khumalo from Polokwane AC, Vusumuzi Sithole from Xcel, Vuyisa Vangile from Belville AC and Bruce Nkuna from Mzansi AC.


I’ve colour coded the graphs to easily see the difference between first and second half fastest splits. For me, the most interesting analysis is how the slower batches trend towards having a fastest split in the second half. Perhaps this is because back of the packers are much more realistic about their goal medal and don’t have “maybe it’s my day” delusions of grandeur.
On the medal front, the pacing of golds and Wally Haywards / Isavel Roche-Kellys is noticeably different to the rest of the field.


The slowest split graphs provide a much simpler but just as interesting perspective. Hardly anyone, just 177 runners, do a slowest split over the much tougher first half of Comrades (that’s quite an incredible stat). The two most noteworthy are Tete Dijana and Piet Wiersma.

For almost half of the field, the sucker punch to the stomach is Botha’s Hill. Botha’s revenge follows the euphoria of crossing the halfway mark and a massive 47% of the field struggles with their slowest split of the day from Drummond to Botha’s Hill.


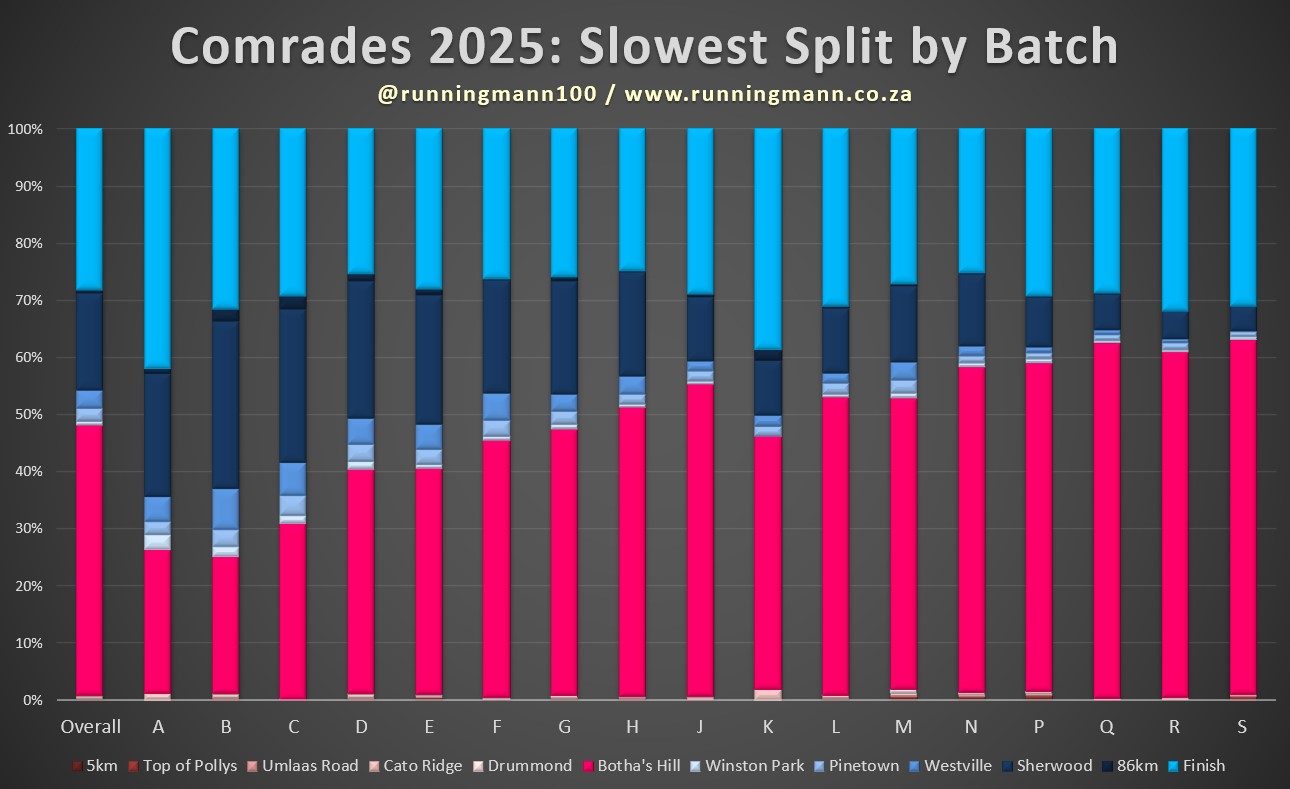
Another 28% run the last 4km to the finish as their slowest split, I assume many of these have secured their medal and have some time to chill and enjoy the atmosphere (personally I am in the “Let’s get this damn thing done” camp when it comes to the final few kilometres).
There are also 17% who find the Westville to Sherwood split the toughest. I checked whether they moved Cowie’s Hill (which is in the preceding split). It’s still in the same place so I am not sure why this split proved so difficult.


On the up run, no one runs up Polly Shortts as their fastest split. On the down run just one finisher runs down Pollies as their slowest split.
Note: The above data only represents finishers. I will see if I can do the same graphs by starters to determine the difference.
Split Comparisons
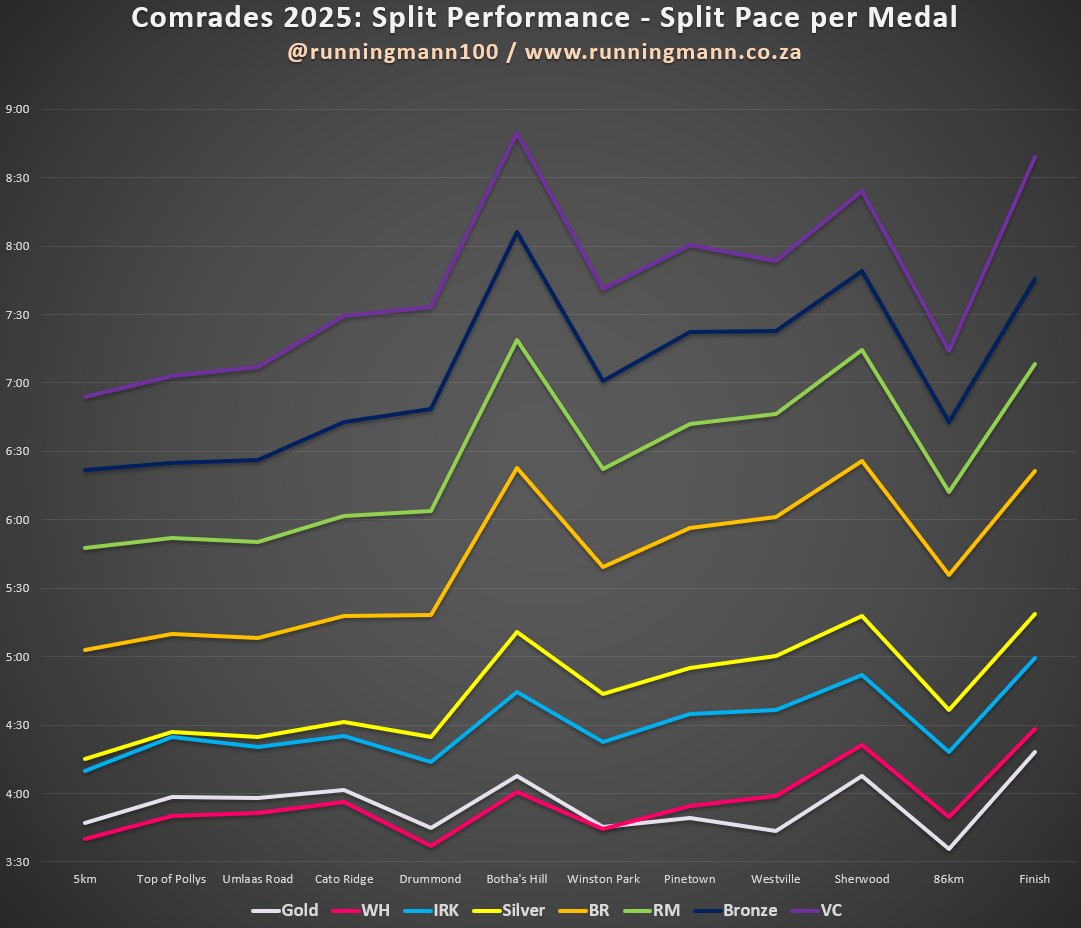
Here are four different graphs comparing split performance.
1. Batch: The sub-elite men relegated to Batch B had a point to prove and they manage to prove it until Cato Ridge. After that there is clear gap between them and the As. There is also a noticeable gap between B and C and then D but after this it starts narrowing.
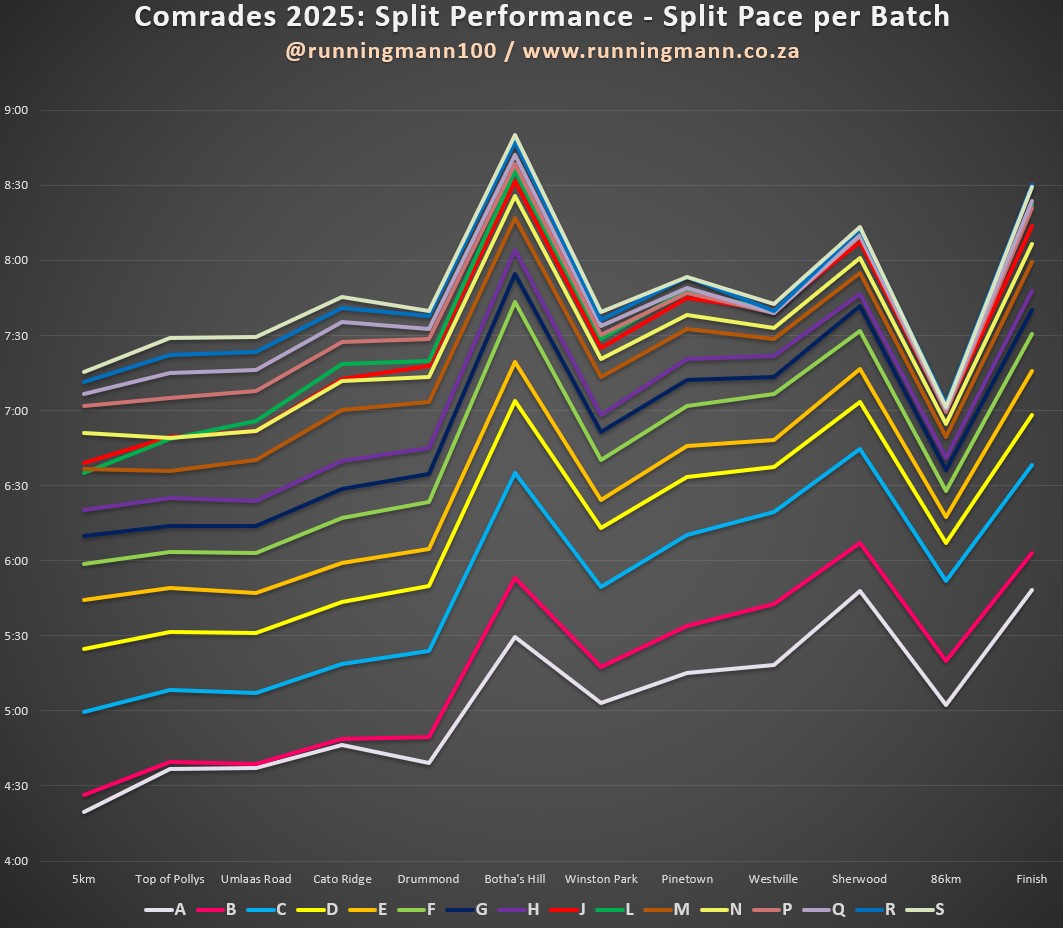
Everyone struggles up Botha’s. It is also noticeable how J batch (at the back of Group 1 with slower qualifiers than M and N) are an anomaly. The only other group that gets their wires crossed is L with the Yellows, Greens and charity runners. It is also noticeable that from Drummond onwards there is little difference in pace at the back of the field.
2. Medal: As expected, this produces a nice clear, distinctive pattern. The exception being Wally medallists who are faster than the golds all the way to Winston Park (note: the Wally Hayward is a male only medal and the gold includes both men and women).
3. Age: Fairly tight groupings for the youngsters and the degeneration as the Comrades runner gets older is apparent. Of interest is how the gap drastically reduces over the final two splits.

4. Finishes: Many novices seem to heed the advice of the wise old heads telling them to “start slowly”. They do just that and wait until Pinetown to speed up. The best performing cohort are the 6-9 medallists. A combination of youth and experience? Interesting how they and the 1-5s converge with exactly the same average pace from Westville onwards.

Split Heat Maps
Here’s a set of heatmaps showing which splits runners found the hardest and easiest. Botha’s Hill is the nemesis of every batch from D onwards whereas A to C struggle to Sherwood. The most interesting trend is the penultimate split from Sherwood to 86km which goes from yellow to bright green as the batch letters progress. Notably, this is the fastest split from P onwards.

Whilst the male and female trends are very similar, the discerning will notice that female average pace is generally faster than men from the same batch over the second half. Separate detailed analysis on this is available in the next section.
The medal heatmap is very similar to batch as one would expect (as batch is a good proxy for expected medal).

The final heatmaps are on age and previous finishes. There are only very minor differences in pacing on both scores, highlighting that the best predictor of split pace is seeding batch.


Men Still the Weaker Sex
I wondered how the smaller seeding batches and additional timing mats would impact what is arguably the most fascinating statistic at Comrades: Comparing the average pace per split of men and women from the same batch.
Bad news guys, you are still getting totally smoked by the ladies.

For those outside the Comrades headspace, this year there were 17 batches. Runners are seeded into batches based on their marathon qualifying time. This means that men and women in the same batch are of the same ability and, all things being equal, should therefore run at a similar pace and finish at a similar time.
This year there were 5 first half splits and 7 second half splits giving us 17 x 5 = 85 first half and 17 x 7 = 119 second half ‘battle of the sexes’ splits to compare.
Over the first half, men win 77 of the 85 splits on offer. What is notable is that whilst men win 100% (68 out of 68) of the first four splits to Cato Ridge, all 8 female victories come in the final split to Drummond. The first half male domination is consistent with data from previous years.
However, Comrades is a race of two halves. Women absolutely annihilate men over the second half, winning 110 of the 119 splits. It’s only in two of the ‘exception’ batches, A and K, where men manage to restore some dignity.
A batch is for the elite gold medal contenders and is a battle of sub-2:25 marathon men versus sub-3:00 marathon women. It’s an unfair fight but the ladies hold up pretty well. A batch Men qualify 31m41s faster than the women on average which should mean that they finish on average about 1h15m ahead but the final result is a paltry 6m42s.
K, where men claim their remaining two splits, was a special batch for Louis Massyn and friends with a small sample size of just 50 men and 18 women. Well done Louis for stacking the deck with some faster men and slower women (CC Barry Holland, Vic Boston and Wietse van der Westhuizen – please take note for when you guys run your 50th Comrades)!
Those of us hindered with an Y chromosome will take whatever we can get. In 2022 and 2023 it was a clean sweep for the ladies over the second half and in 2024 we claimed just one second half split courtesy of the CC charity batch.
But does this translate to a faster finish time for women? The short answer is “Yes”. Men qualify faster in every batch except E, H and J. However, women come out with a faster average finish time across 12 of the 14 ‘regular batches (A and K have been mentioned already and the remaining ‘special’ batch is L for the Green Numbers and charity runners).
It’s the men towards the back of the field in P and S that restore some honour for the supposedly stronger gender with a pair of narrow victories. However, it’s the C batch men who take the biggest bashing, finishing on average over 22m51s behind their female contemporaries.
Testosterone and ego are clearly still a major handicap when it comes to ultra marathon running. Forget the social media opinionistas, eschew the experts and ignore the mansplainers. The best Comrades advice that anyone can possibly give you is “Run like a girl.”
READ MORE: Run Like a Girl (A Guide to Optimal Pacing at the Comrades Marathon)
Best Club Performance
The best finisher rate by club at Comrades is pretty much like the Best Picture Award at the Oscars. And for the second year in a row, the award goes to… the mighty Fourways Road Runners with a 95.6% success rate!

But wait – someone better check who is running these stats and do an audit. OK, busted… last year the criterion I used was 50 or more starters so, unlike at the recent KZNA AGM, we won’t manipulate the process to unduly influence the results. On this count Midrand Striders with 97% narrowly take the title from Randburg Harriers by 0.1%! Pirates in 4th are the top club with over 100 starters. Alpha Centurion and Jeppe round out the top 10 highlighting Gauteng club dominance.

Other provinces represented in the Top 10 are the Eastern Cape’s Oxford Striders, KZN’s Faku Chiefs, Mpumalanga’s Thungela and the Western Cape’s VOB. Narrowly missing out on Top 10 spot are Bloemfontein’s Centre City Titaniums who hosted the excellent Lemo Mall Marathon on the last weekend of qualifying.
This year, the Best Foreign Picture moves from Botswana to Zimbabwe with Harare AC’s 90.3% edging last year winners Gabarone Striders with 89.7%.
There are 11 clubs with 20 or more starters who had a 100% success rate at Comrades 2025. Cape coastal club Strand has the most with 35 followed by XJ from Transkei, ATC Multisport (also on the Cape coastline) and eSwatini’s Golden Foot Club.

ATC and Golden Foot also had a 100% success record in 2024 as does Kwa-Thema Striders from Springs. And with Louis Massyn running his 50th Comrades, none of his Outeniqua Harriers clubmates were going to spoil the party.
Looking at the clubs who had the highest proportion of their qualified entrants actually starting the race, we have three clubs with perfect records: locals Maritzburg City AC, tourists Harare AC and the Pretoria Police Marathon Club. There are also three SAPS branches in the Top 20 – clearly our coppers like all the free cooldrink along the route!

Generally the larger a club, the harder it is to appear in these stats which makes the 4th placed drop out rate of just 2.3% from the 1027 Hollywood AC KZNA runners even more impressive. Their CGA branch is in 19th and joins 20th placed Team Vitality KZN as the only clubs with over 100 qualified runners on the Top 20.
Another surprise is that there are several clubs that appear on both the Top 20 start and finish rate charts: Midrand Striders, Fourways Road Runners, Alpha Centurion AC, Centre City Titaniums AC, Xcel RC, Maritzburg City AC and Harare AC.
A final club view provides a summary of entrants to finishers for the 50 clubs with the largest number of qualified runners. The heat map shows which clubs performed the best (dark green) and worst (dark red) to get their entrants qualified, their qualified runners started and their starters a medal.

RCS Gugulethu is the only club that manages to get 100% on any of these categories with all 100 of their entrants qualifying. The only club to score above 90% on the full lifecycle comparing entrants to medallists is Midrand Striders.
Most Silvers by Club
There were just 764 people who finished under 7h30 minutes. The table below shows the clubs with the most silverware (note: the numbers include all finishers under 7h30 not just silver medals). There is a steep drop off between #1 (Hollywood with 92) and #2 (Waterfall City with 20). They were also #1 and #2 in 2024 with 116 and 21 respectively.
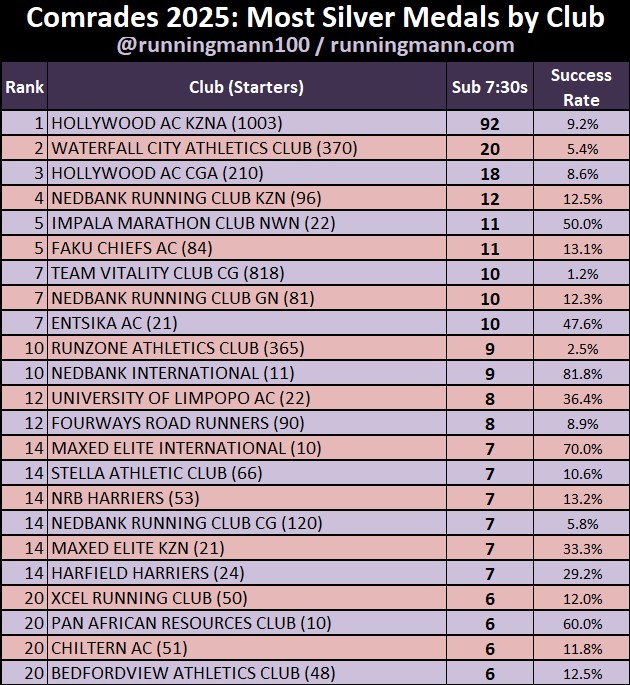
Faku Chiefs who were 3rd in 2024 slip to 5th but these days it’s rare to see a non-professional club with more than ten silvers. Fourways are going through a golden period when it comes to silver medals (juxtaposition intended) – 8 is a record for the club. Other non-professional clubs in the top 20 are RunZone, Stella, NRB Harriers, Harfield Harriers, Bedfordview and Chiltern.
A special shout out should go to Sean Smith who ensured that Chiltern got their sixth silver. Watching the silver cutoff on TV I thought he was cooked when he collapsed and couldn’t get back up. What followed was one of the most impressive horizontal hustles ever seen at Comrades for a dramatic 7:29:29 roll over the line. I am somewhat dubious of line crawlers (especially when they milk the attention for everything it’s worth) but you could see the physical exhaustion and emotional relief that made Smith uninterviewable (the attempted interview had to be aborted and his friend interviewed instead perhaps only trumped in awkwardness by the attempted engagement later in the day).
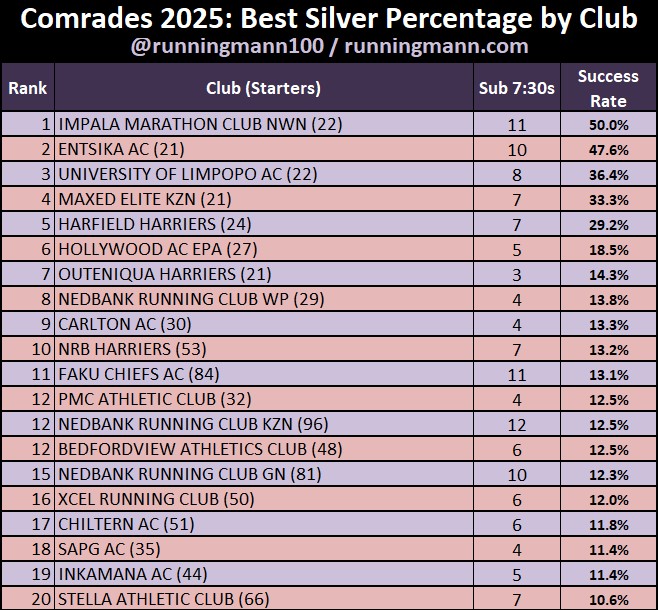
As one would expect, the professional / semi-professional clubs have the best success rate with percentage of starters finishing under 7h30 (minimum criterion 20 starters) but some of the lesser fancied names come out on top with the podium being filled by Impala MC, Entsika AC and former winner Ludwick Mamabola’s University of Limpopo (he is the head coach and added one to the medal count this year).
The first traditional running club on the list is 5th placed Harfield Harriers whose 7 silvers are all members of a Cape running crew known as the ‘Outliers’ – and featured in an article I wrote about another of their members, Maretha Smit, who has the joint record for most Isavel Roche-Kelly medals.
READ MORE: Maretha & her medals (An outlier amongst Outliers)
Country Performance
Angola is the only country with 20 or more starters to earn a perfect report card with 100% of their starters finishing the race. Russia is in second with 96.7% followed by a number of African countries: Zambia, Uganda, eSwatini, Namibia and Zimbabwe. Canada, in 8th, earn bragging rights over their noisy neighbours who are at the deep south of the table (almost 1 in 4 American starters fail to earn a medal). However, the USA saves the blushes from the South Africans who are in second last place.

Angola goes from top to bottom, residing at the foot of the qualified to starters table. The USA is in second last position. It appears that it is not just the American president who is in the habit of chickening out.

African countries dominate the top of this chart with eSwatini, Kenya and Lesotho at the summit and occupy 8 of the top 10 positions with only Brazil in 6th and the Netherlands in 10th spoiling the party.

In terms of starters, there are just seven countries with 100 or more starters: India (361), Zimbabwe (361), United Kingdom (289), Botswana (239), Russia (214), Brazil (161) and USA (130). The relatively low international (especially overseas) numbers show just how parochial Comrades is but is a major growth opportunity.


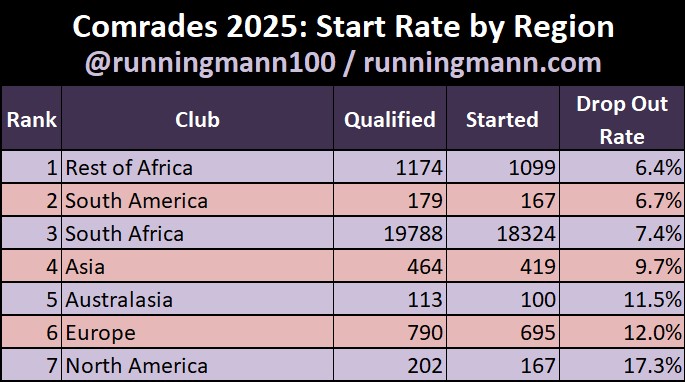
Grouping by continental region, African visitors to South Africa are the most likely to both finish the race and make it to the start followed by South Americans on both counts. Europeans are 3rd on the finish rate chart whilst South Africans take the last podium spot on the start rate list. North Americans go away with two wooden spoons.

Getting Provincial
Gauteng has more than twice the number of finishers than every other province – almost every second South African Comrades runner is wearing GP license plates. Add KwaZulu Natal into the mix and you have almost 70% of the local field. The Western Cape is in third with 10.2%.

Adding the international entrants into the equation, Gauteng drops to just below 40% (as a comparison this is slightly lower than the 2024 figure of 41.6%). The rest of Africa percentage is up a point from 4.5% in 2024 to 5.6% whilst the overseas international entries grow even more from 6.0% to 7.6%. These are both encouraging trends.

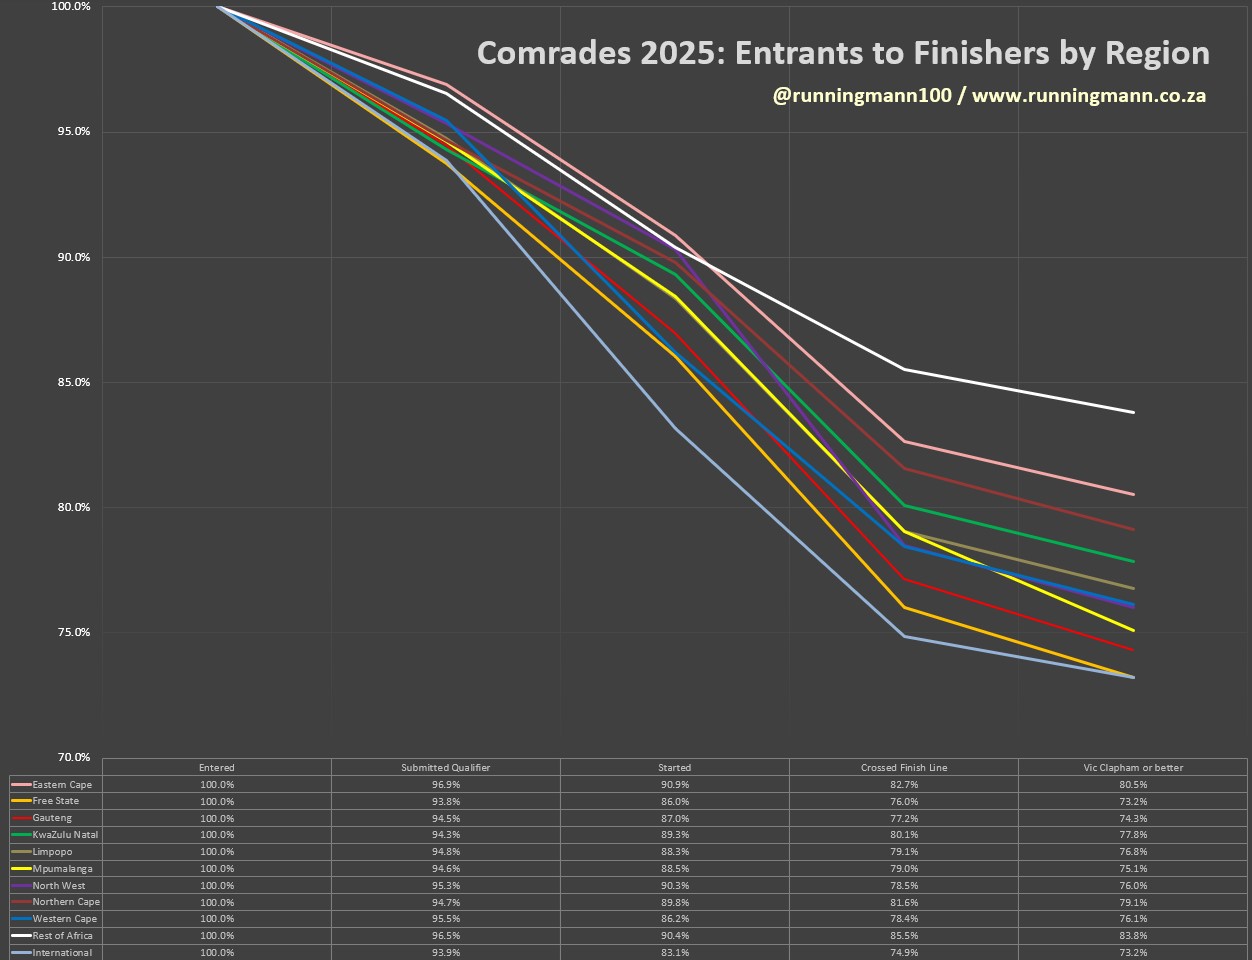
For the second year in a row Eastern Cape runners claim bragging rights as South Africa’s toughest ultra runners with a 88.6% success rate. Western Cape (88.3%) are second again but Northern Cape (88.1%) replaces Gauteng in third. This is a big change for South Africa’s least populated province who were in a three-way tie for the 2024 wooden spoon award with Limpopo and North West. This year North West claim the title unchallenged.

The next graph shows the progressive journey off all provinces and internationals from entries to finishers. This highlights that the Eastern Cape have the most committed Comrades runners in South Africa but runners from other African countries come out overall on top. Overseas international runners are the lowest in all categories but the Free State keeps them company when it comes to earning a medal.
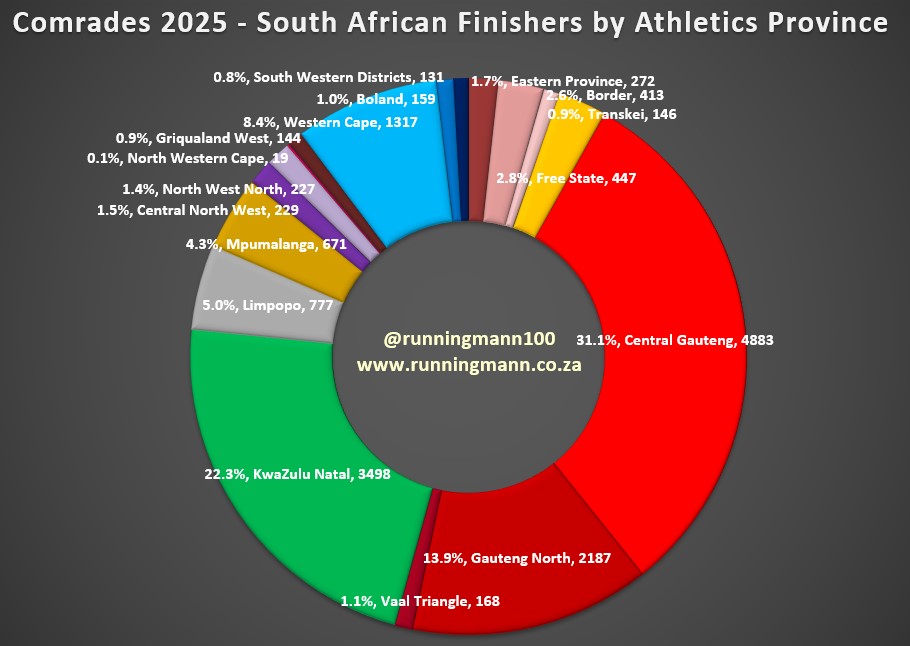
I decided to go one level deeper and look at success rate by athletics province. Amazingly the three Eastern Cape subdivisions, Transkei, Border and EPA come first, second and third in that order. Transkei have just below 1% of the local finishers with 146 but 101 of these come from just two clubs, Cheetahs and XJ AC, so kudos to them!

I’m not sure if it’s something in the air or the lack of hills but the Vaal Triangle are by far the weakest of the herd in 2025 with 1 in 4 of their starters failing to return home with a medal.
The pie graph shows the percentage and number of runners per athletics province. Central Gauteng is by far the largest province with over 31% of the market share at just under 5000 finishers. The smallest is North West Cape (essentially the town of Upington) with just 19 runners.
Predicted versus Actual Finish Time
Using an athlete’s qualification to predict finish time plots a nice bell graph. The traditional method for mortal runners is to take the marathon time and multiply by 2.5 whilst for elites is to double the qualification time and add one hour. The data shows that there are a lot more mortals than elites. Very few people, just 406 (2.2%), can beat the elite predictor of *2+1h.

Just over a third of the field (36.4%) manages to run faster than their predicted time using the *2.5 method but, notably, over half of the female finishers achieve this. More evidence that women run Comrades better than men. The overall figure was 35.2% in 2024 which was a ‘short course’. However, the increase in 2025 can be explained by the restoration of the qualification time to 5 hours (anyone with the 4:48+ qualifier who finished beat the *2.5 predictor).

The graph plots potential versus reality. The reality is that qualifier *2.5613 would be provide a better predictor of finish time (*2.58 for men and *2.49 for women) but the correlation is fairly loose. To get to 80% of the finishers requires a 2 hour grouping (from beating predictor by 30 minutes to losing by 90 minutes).
Note: If an athlete qualified with an ultra, I’ve used an algorithm to adjust this to a marathon time with a ‘time discount’ for the extra distance. However, no adjustment is made for difficulty of qualifier route.
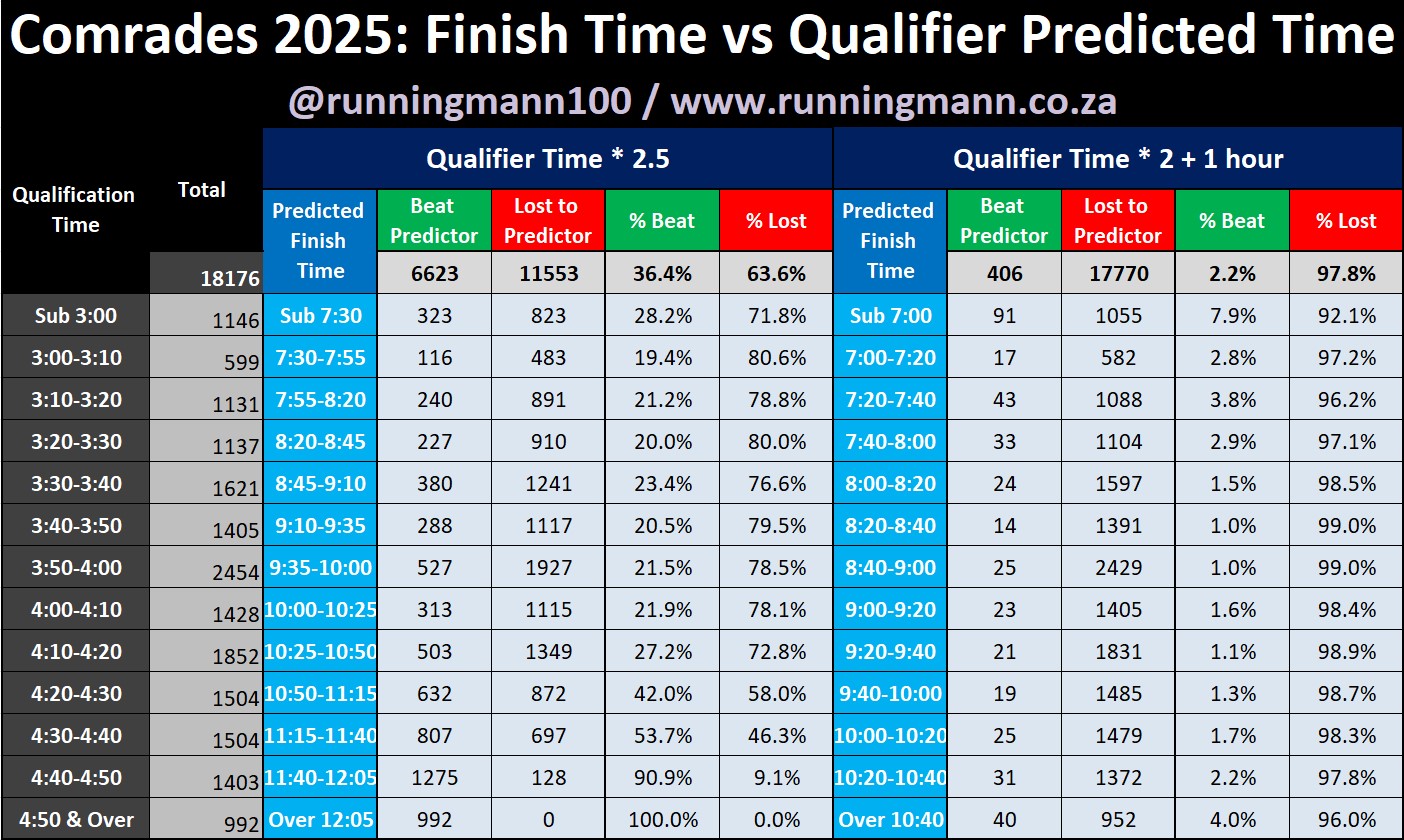
Taking a look at actual finish time versus predicted time by qualification time makes for some interesting analysis. At the fast end of the traditional *2.5 calculation table for medallists, the sub-3 marathoners manage a 28.2% win rate. Whilst this might seem low, the rate hovers around 20% (with a small hump on the Bill Rowan cutoff) and you have to wait until 4:20 qualification before you see a better result. From there it steadily increases (and anyone who ran 4:48 or slower has to beat the equation to earn a medal).

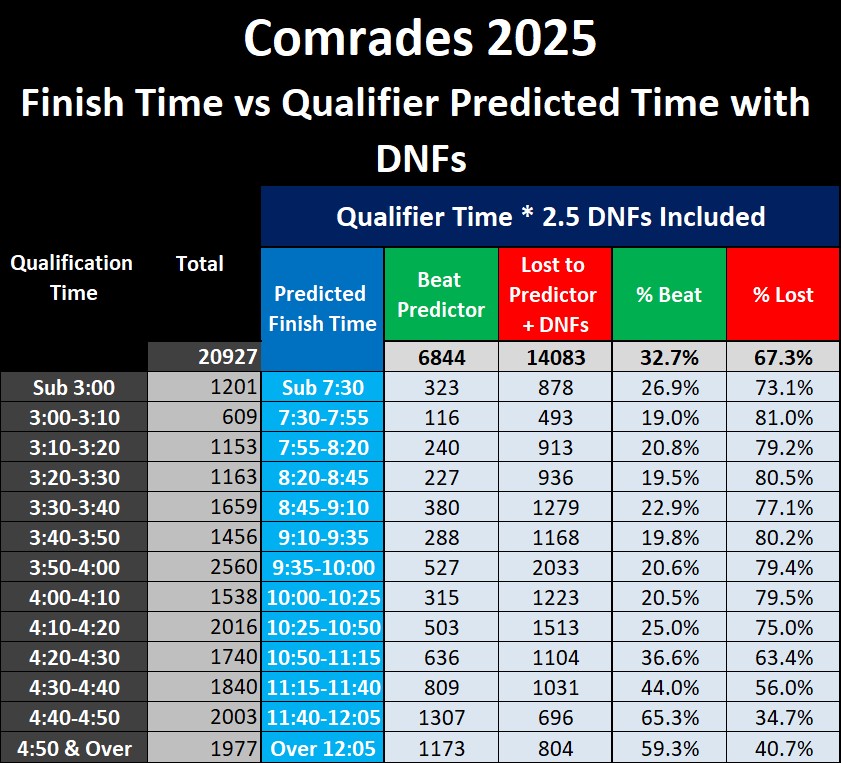
To take account of survivor bias, I’ve included a second table of which also includes DNFs and those who crossed the finish line over 12 hours. Those with the slowest times have the biggest DNF rate and from 4:20 onwards you can see the predictor beaters are much lower than when only medallists are considered. However, even accounting for attrition, those qualifying from 4:20 onwards are much better at realising their potential than their faster brethren.
The elite *2 + 1 hour is a tough algorithm to beat but the elites and sub-elites earn their status with the highest win ratio of 7.9%. Once again there is a Bill Rowan bump but, at 4%, surprisingly the second best cohort at beating the elite equation are those who qualify with 10 minutes or less to spare.
By special request I’ve done a ‘beat the predictor’ table split into coastal and inland marathons. This only includes South African qualifiers and I’ve done a very simple categorisation with Western Cape, Eastern Cape and KwaZulu Natal being coastal and everyone else being inland.
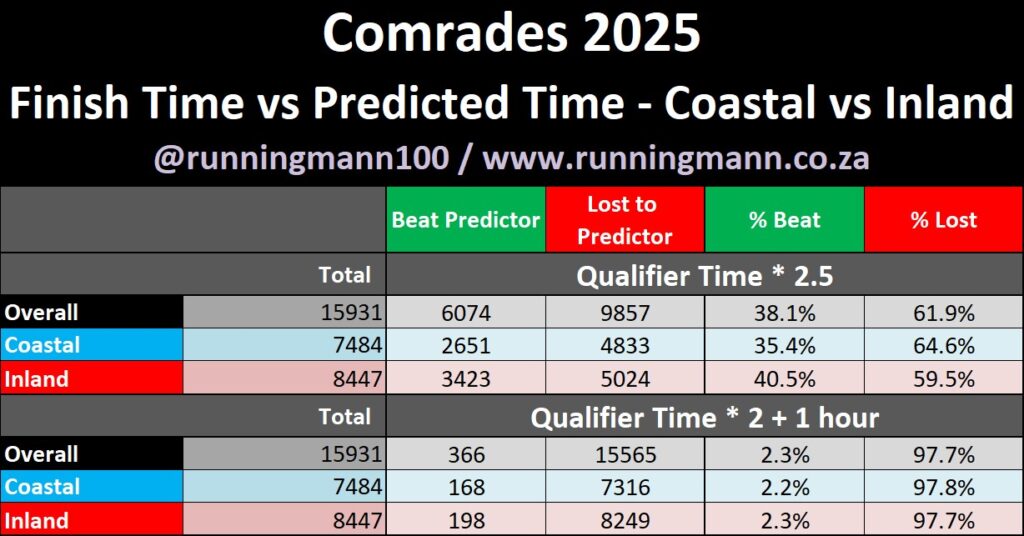
This highlights the impact of running at altitude with runners who qualify while breathing thinner air 5.1% more like to beat their predicted time than those who qualify at sea level.
I’ve included a table of the Top 50 athletes to beat their predicted time by the largest amount. In previous years, the table was dominated by Russians using tough 100km+ trail races as their qualifiers. However, this year South Africans claim all the podium spots.
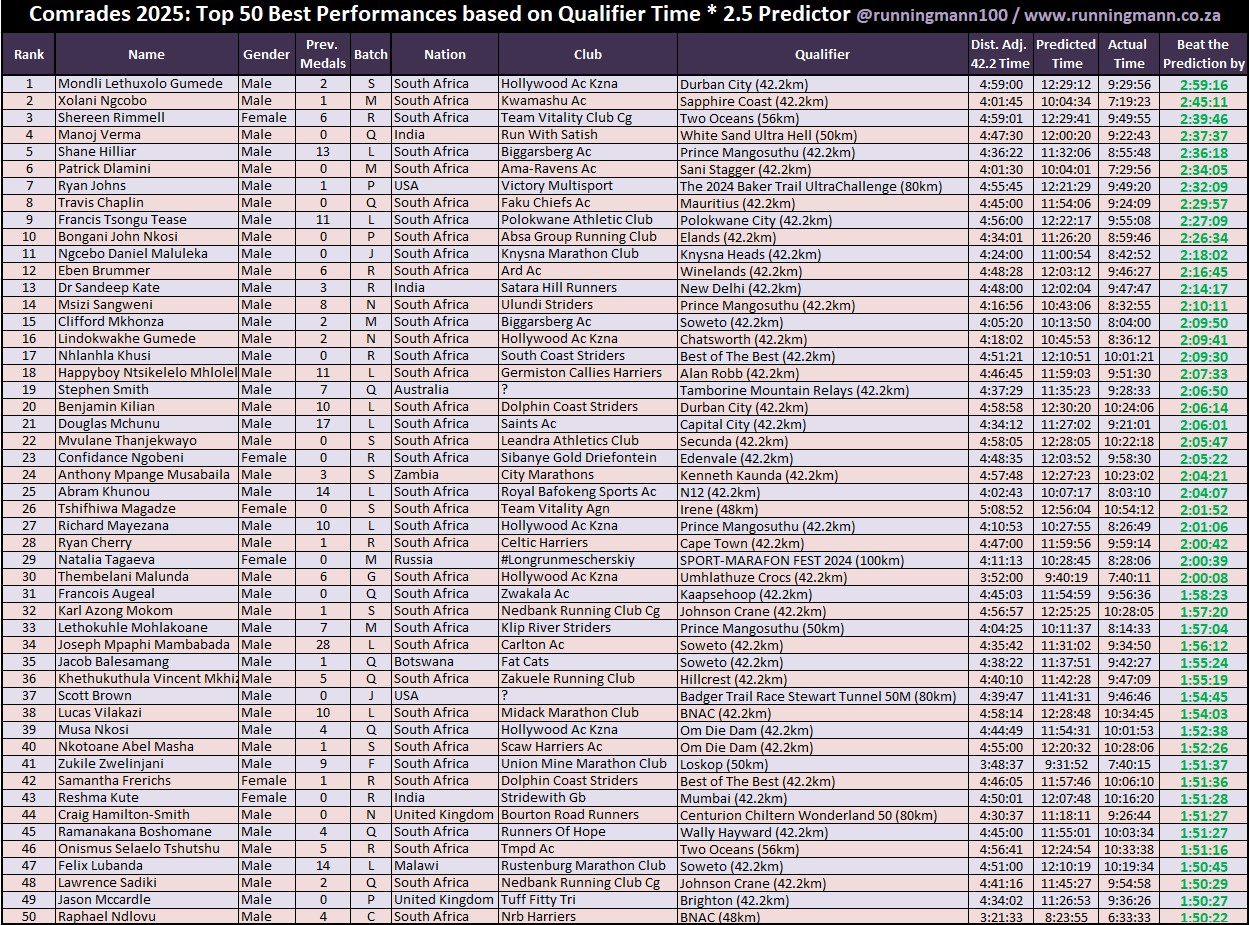
Hollywood’s Mondli Lethuxolo Gumede grabs top spot on the *2.5 chart translating his last minute qualifier at Durban City into a solid 9:29:56 Robert Mtshali medal which is almost 3 hours better than his predicted time. Xolani Ngcobo from KwaMashu tops the *2+1h chart securing a 7:19:23 silver from a 4:01 qualifier at the Sapphire Coast Marathon (which had awful weather conditions last year).
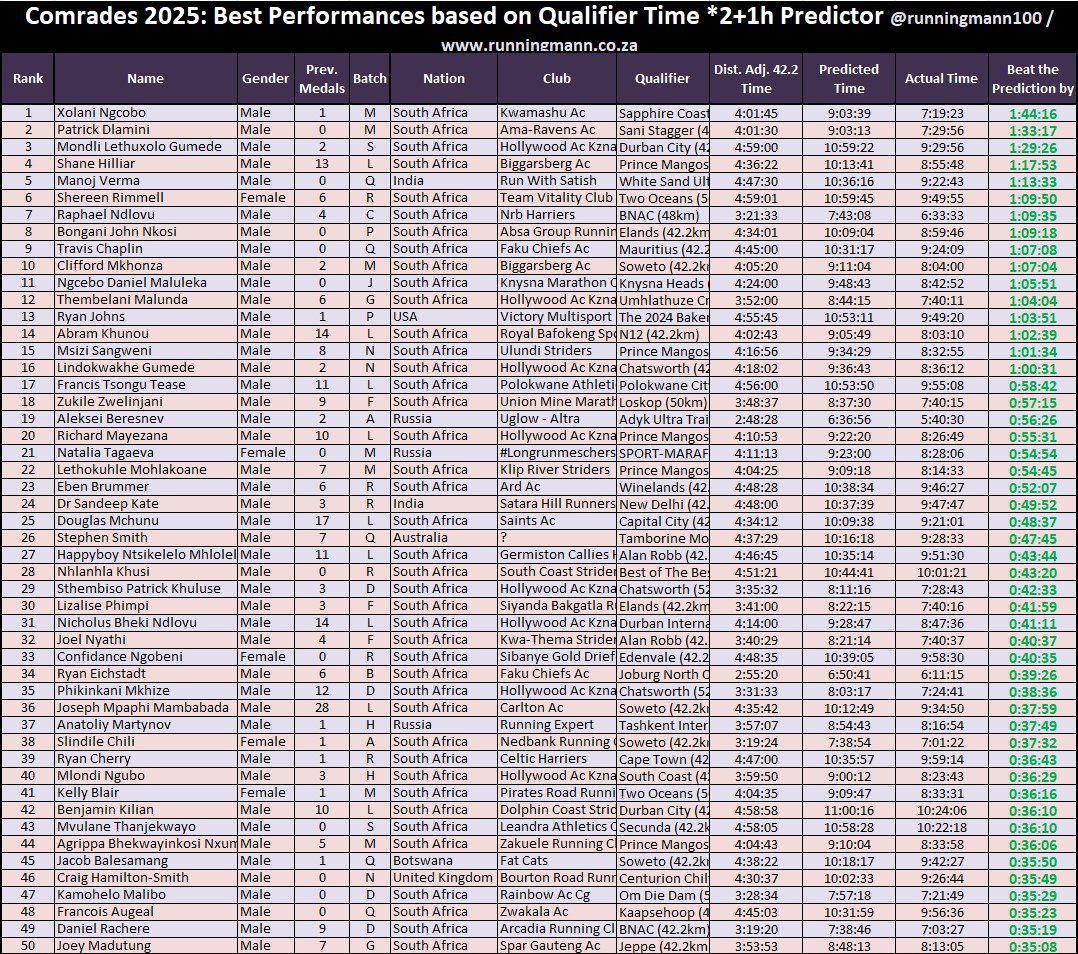
The top international runner on both charts was Manoj Verma from India who used the intriguingly named White Sand Ultra Hell 50k race as his qualifier. This is run on the shifting sands and salt plains of the Rann of Kutch (White Desert) in Gujarat. According to ChatGPT, the heat often soars to 45 °C and “Runners frequently report hallucinations from sleep deprivation, constant pain and sheer mental exhaustion.” Sounds like fun.
As for why and how such big beatings of the predicted time are possible, there are a number of possibilities. For some runners they have one shot at a qualifier marathon (this could be for various reasons like proximity to qualifier marathons or economic factors) and if they have a bad day then they have to live with a poor seeding. There are the Green Numbers who get their automatic seeding and therefore just use any marathon, regardless of whether they’ve ‘raced it’ or used as a training run. There is the possibility of a data error, I know that there were some people who put in an ultra time but the system recorded it as a 42.2 (Note: if officially recorded by the timing company, you can use you marathon time during an ultra). One other possibility is bib banditting where someone runs in another runner’s number (I often compare race photos to the listed age and gender but have not done so this year).
Repeat Runners: Comrades 2025 vs 2023/4
There were 13,036 returning runners from 2024 in 2025 and 9,484 ran both 2023 and 2025. We had ‘Comrades Lite’ in 2023 and 2024 with shorter distances than normal (87.7 and 85.9km respectively) but 2025 was back to normal with a 90km down run. This made it harder for repeat runners to achieve a faster time in 2025 but 2,808 manage to beat their previous down time and 5,468 beat last year’s up run time.
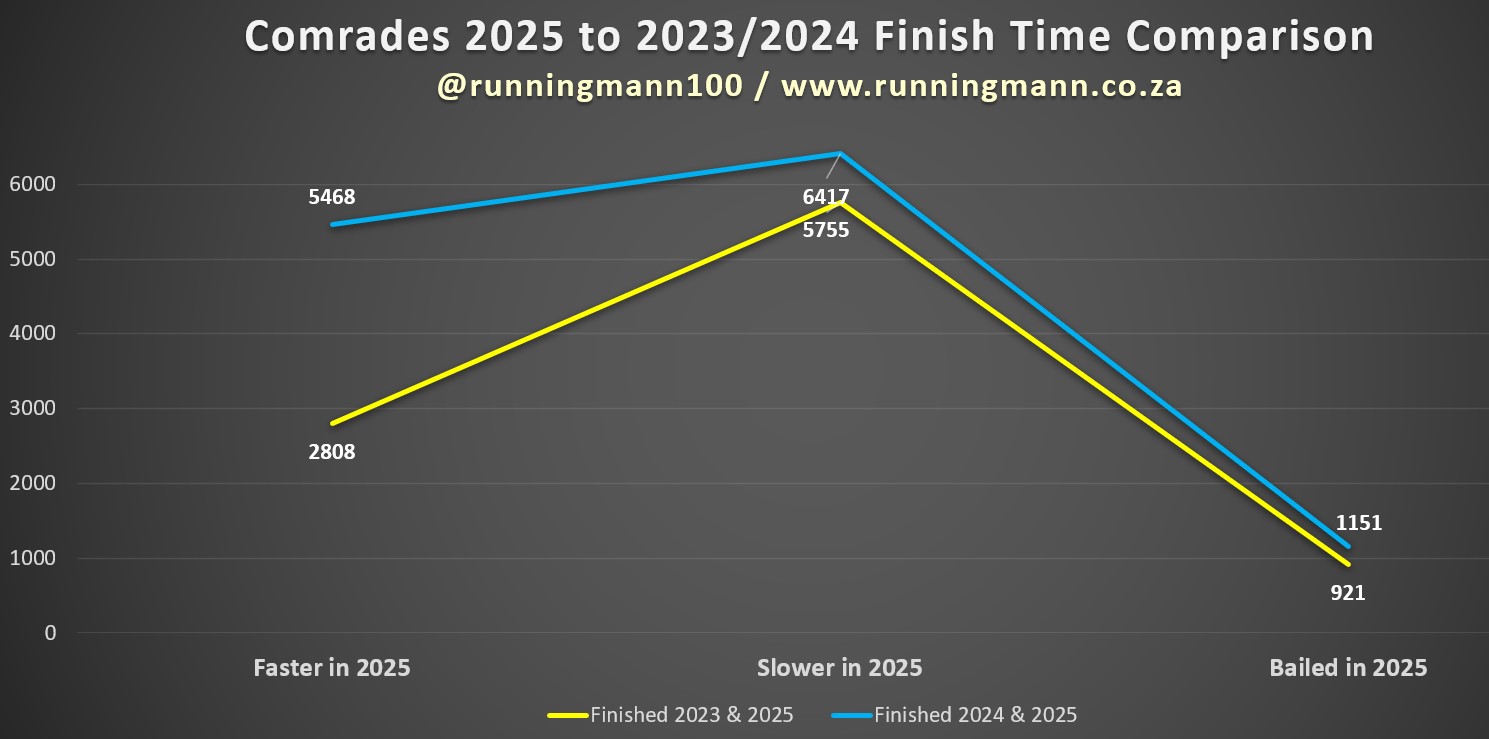
However, if one normalises the times to adjust for the difference in distance, the class of 2025 performs much better with 4,169 beating their 2023 time and a massive 8,945 their 2024 up run. Statistically, the up run produces slower times on average so this result is not surprising.
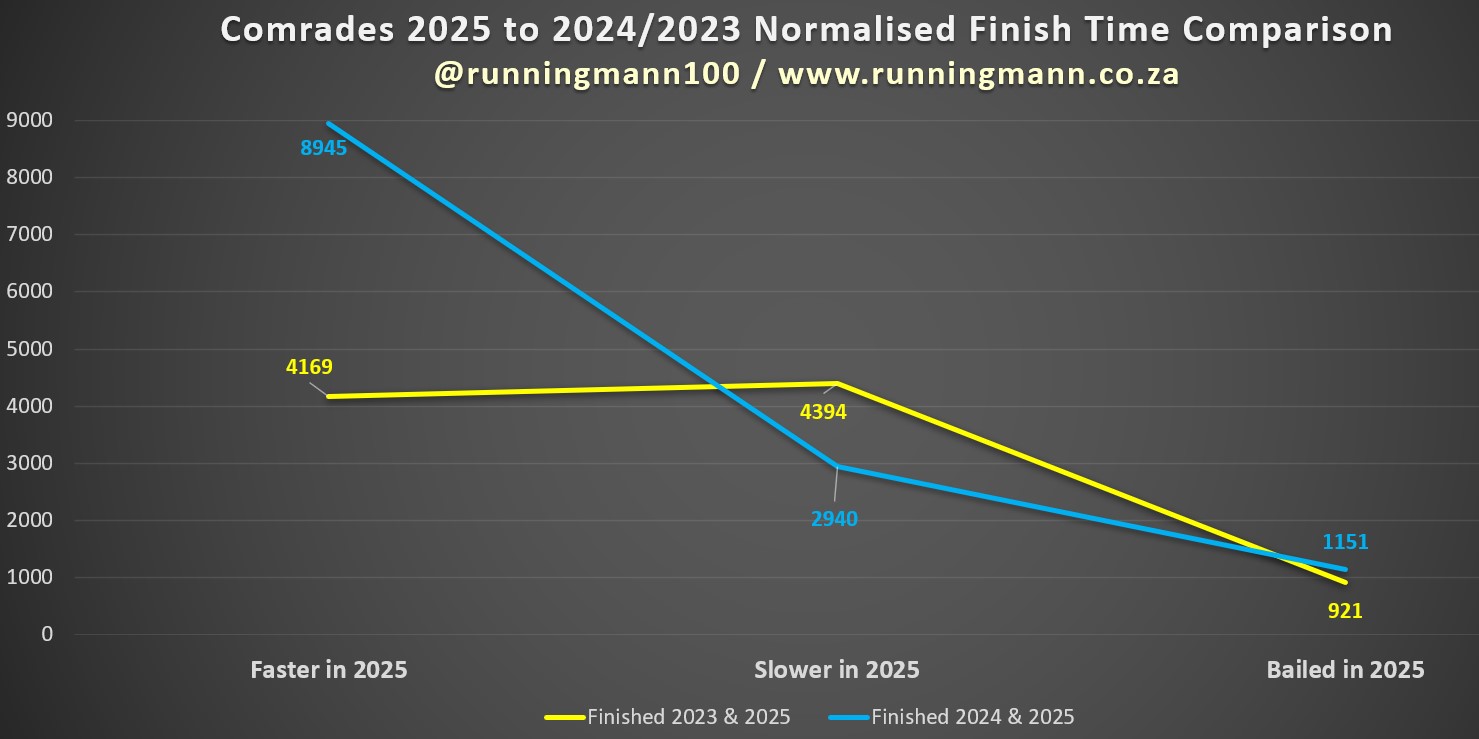
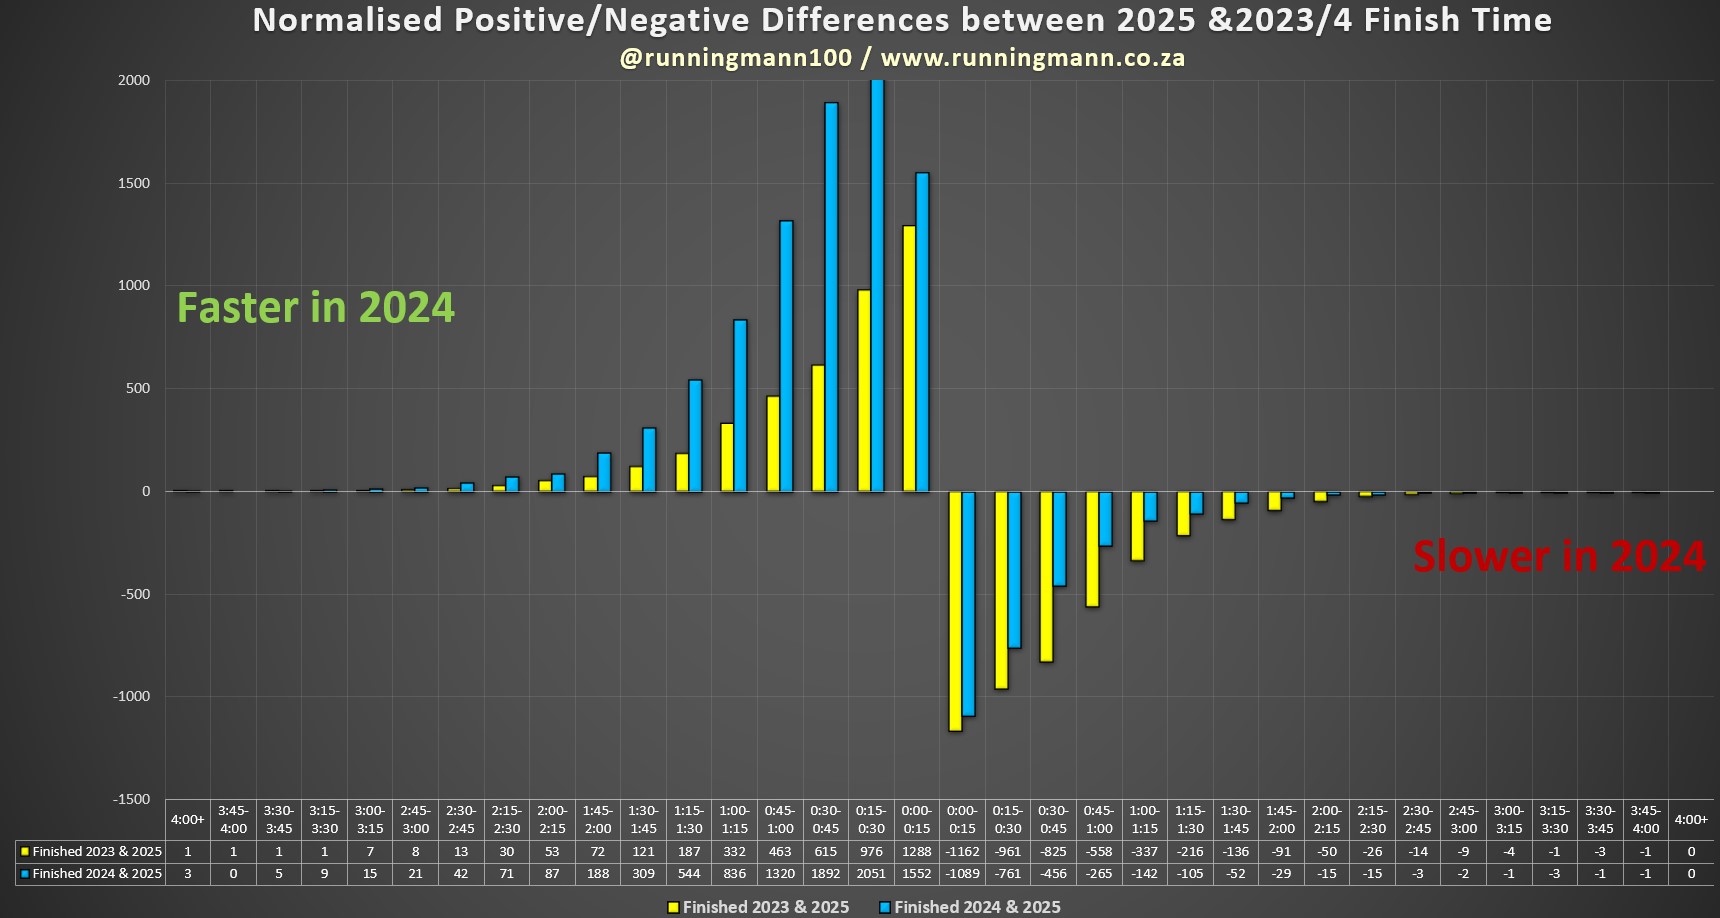
The second set of graphs plots the time difference of every 2023 and 2024 repeat runner by 15 minute splits on actual and normalised finish times. As one would expect, most people finish relatively close to their 2023 and 2024 times. There are some spectacular improvements and deteriorations are covered in the next section.

Biggest Improvements and Deteriorations (2025 vs 2023/4)
Here’s your list of the biggest improvements and deteriorations between 2025 and 2023 / 2024 finish times. Bafana Radebe from Chillie RC improved his down run time by an astonishing 3:50:02 but I’m sure he would have like to have better that mark by another 5:35 to earn a silver.
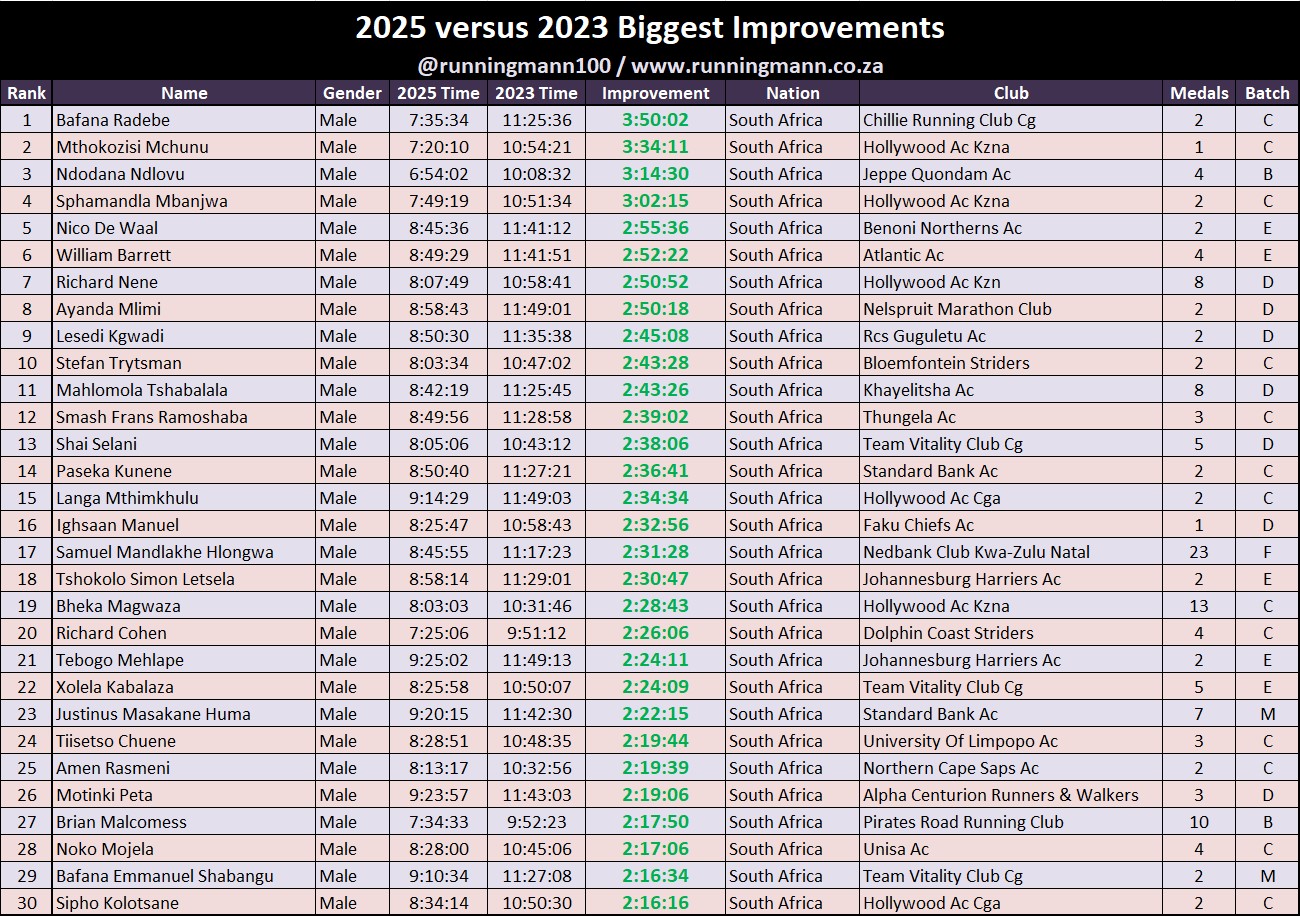
On the 2024 list DUT’s Ngceba Kenisa manages to break the 4-hour improvement barrier but still finishes behind third place finisher Nikolai Volkov. Volkov was in the top 5 at Drummond in 2024 but imploded and eventually finished in 4923rd place with a 9h32. That’s some comeback from him in 2025. Not one women makes the 2023 improvement list and Chanelle Nandi Birch is the solitary lady on the 2024 chart.

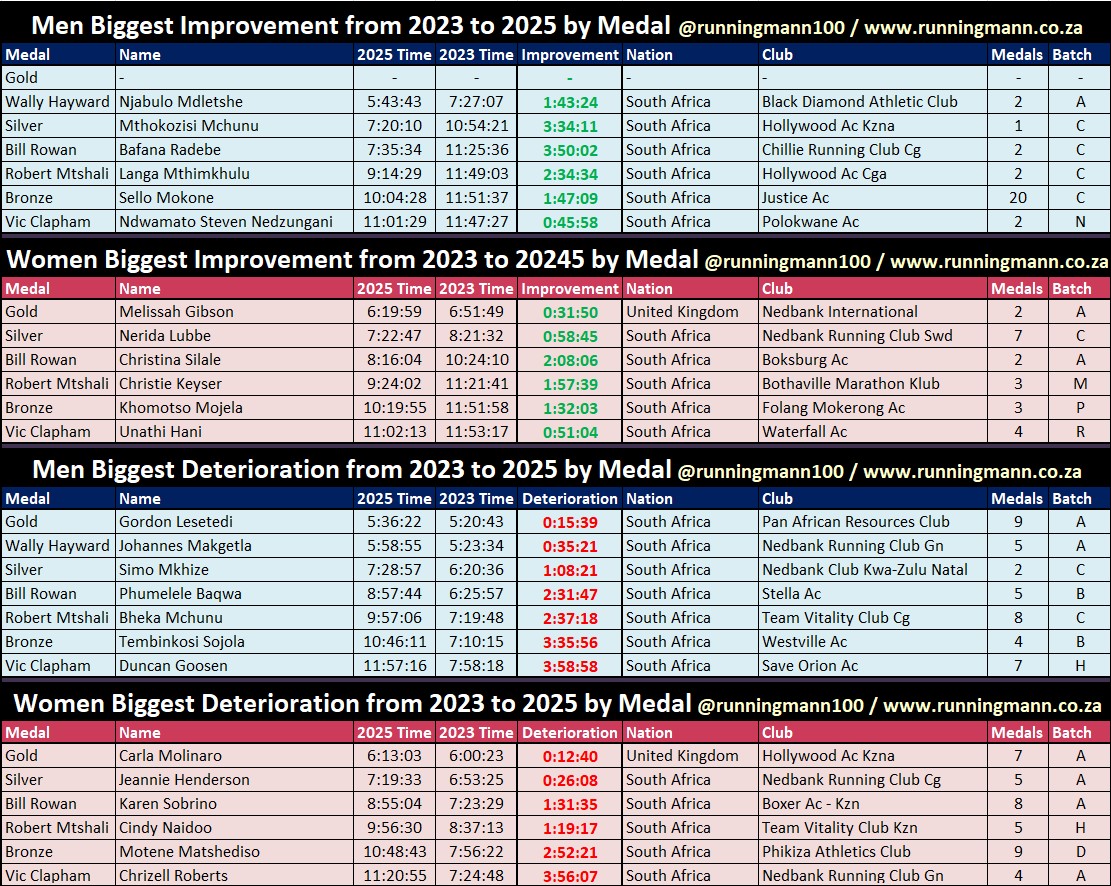
Duncan Goosen from Save Orion dominates the deterioration charts. He finishes ahead of Chrizell Roberts (whose torrid day was documented in the biggest positive splits post) on the 2023 comparison but misses out by almost half an hour to Rene Kalmer’s 4:20:12 time differential from her 2024 debut. One day you’re running in the Olympics and then you appear on The Running Mann’s biggest deterioration list… Rene does have a valid excuse though – she was running with her (much slower) husband.


I am sure that there are plenty of other good stories out there – and I’m always listening if anyone is sharing!
Also included are tables highlighting the biggest improvement and deterioration between 2025 and 2023/4 by medal and gender. If you spot a friend on the biggest improvement list let them know. If you spot a friend on the biggest deterioration list, make sure you invite them for some LSD next weekend.

Mercedes Benz runners Monde Louis Booi and Anathi Ngelanga put on the cruise control to finish Comrades 2025 in the same time as their 2024 run with well-paced Robert Mtshali and silver medals respectively. This is quite a coincidence since Mercedes Benz had just 21 finishers. Everyone on the 2024 list is within a second difference.

The 2023 Mr Consistency title goes to Khaya Tsetse from Rand Athletic Club who earns another solid Bill Rowan. The Ms Consistency title goes to Maretha Smit who was just 1 second slower this year to earn her fourth Isavel Roche-Kelly medal. Maretha holds the joint record (with Renata Vosloo) for the most IRKs.
Men’s Fastest & Slowest through each Split by Medal
Here are the lists of male athletes who went through each split the fastest and slowest by eventual medal earned (this is the cumulative time). Generally, you don’t want to appear on the fastest list over the first half – it’s normally a guarantee of a massive positive split.
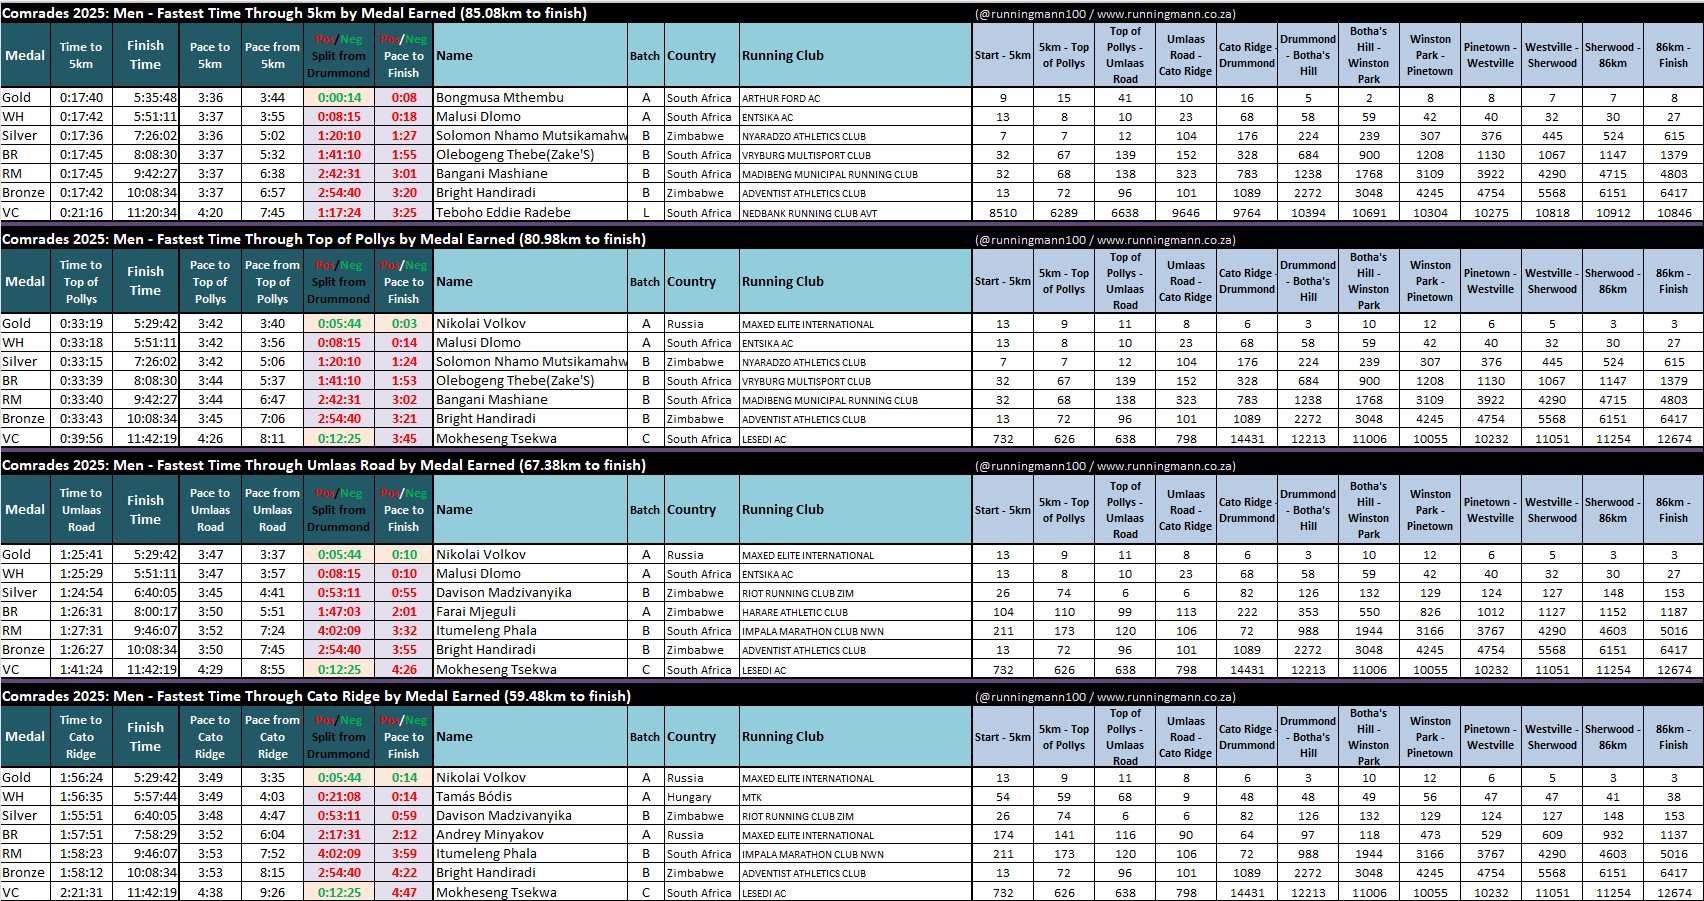


The race field position is included so you can see the general trend for time based medals is that those who start fast end much further back in the field whilst those on the slowest list in the first half overtake thousands over the second half.
For the golds, only Bongmusa Mthembu, Nikolai Volkov and Tete Dijana appear on the fastest list. Alex Milne and Vasilii Korytkin are the splits to look at on the bottom end of the slowest table. Both slice through the field to finish 6th and 10th respectively.
I always pay particular attention to the slowest time through Drummond by medal – this provides a list of what is possible for future runners and highlights some exceptional negative splits from silver onwards. Well done to Mphutlane Modibedi (silver from 3:47:12), Tsietsie Paka (Bill Rowan from 4:37:56), Matthew Bannister (Robert Mtshalie from 5:15:51), Vuyisa Vangile (bronze from 5:44:25) and Nangolo Ashipala (Vic Clapham from 6:11:47).
Another fascinating section to look at is the slowest to each of the last two splits. These are the runners who threw everything they had into the last 8.5km to make their medals with seconds to spare.
Notes:
- The Pos / Neg Split column is from and to Drummond whereas the Pos / Neg Pace is from and to the relevant split.
- Rounding errors (depending on how many decimals I used) can make a difference of +/- 2 seconds on pace.
Women’s Fastest & Slowest through each Split by Medal
Here are the lists of female athletes who went through each split the fastest and slowest by eventual medal earned. Unless your name is Gerda Steyn, you don’t want to appear on the fastest list over the first half – it’s normally a guarantee of a big positive split. In fact, Steyn is one of the only female athletes on the ‘fastest’ lists who manages a negative pace. You will notice a stark contrast on the ‘slowest’ tables where there are far more negative splits and pace.


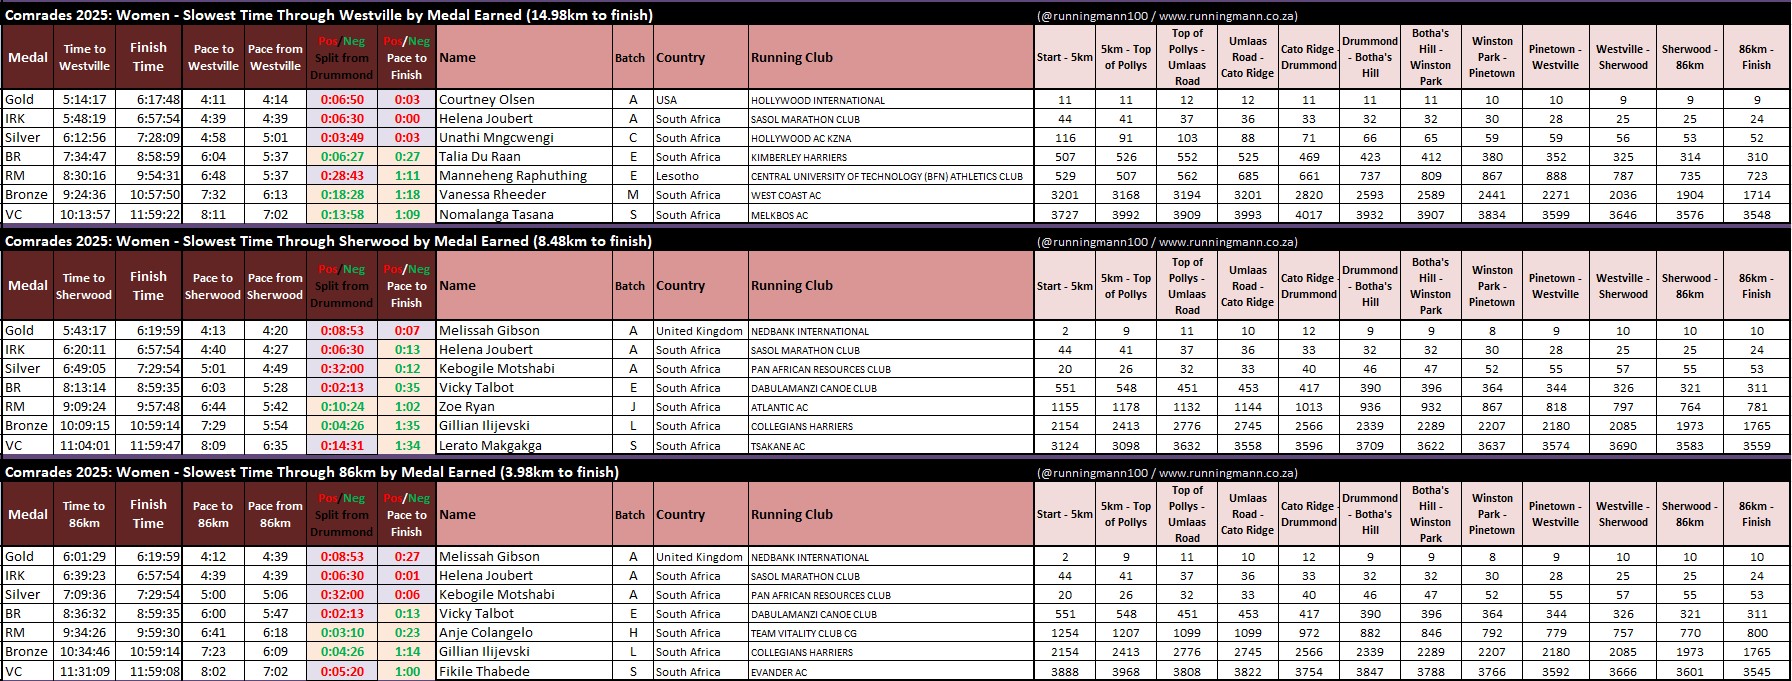
Names to look out for on the slowest list are Jenet Mbhele and Helena Joubert who dominate their well-paced gold and Isavel Roche-Kelly medal categories respectively. At 49, Joubert is also by far the oldest IRK medal winner in 2025. One very interesting stat that has never happened before is Melissah Gibson managing to bookend the gold category by being the fastest to the first split and then the slowest to the final split.
An example about just how tough and unpredictable Comrades can be is Russian debutant Polina Avdeeva’s run. She looks to have paced herself well and is in gold medal contention at Westville before Comrades throws a massive curveball her way and she ends up finishing as 788th female.
From silver onwards the slowest times to Drummond are all negative splits earned by Wida De Klerk (3:44:20 silver), Nadia Van Rooyen (4:36:07 Bill Rowan), Lomé La Grange (5:08:54 Robert Mtshali), Ketaki Sakharpe (5:46:20 bronze) and Nomalanga Tasana (6:06:40 Vic Clapham)
Accolades also to those who appear on the final two slowest splits charts and make their time with seconds to spare. Of note here are Zoe Ryan, Gillian Ilijevski, Lerato Makgakga and Fikile Thabede who all run over a minute per kilometre faster than their average pace over the final splits to earn their medals.
Fastest & Slowest per Split by Medal Earned
This is similar to the above section with the difference that this looks at each split in isolation whereas the previous stats looked at fastest / slowest cumulative running time to that point. As with the “through splits” analysis, it’s generally better to be on the slowest list before Drummond and the fastest list after Drummond.
These tables show the men who ran the fastest and slowest between each split by medal (i.e. each split in isolation). As a general rule of thumb, it’s usually better to be on the slowest list before Drummond and the fastest list after Drummond.
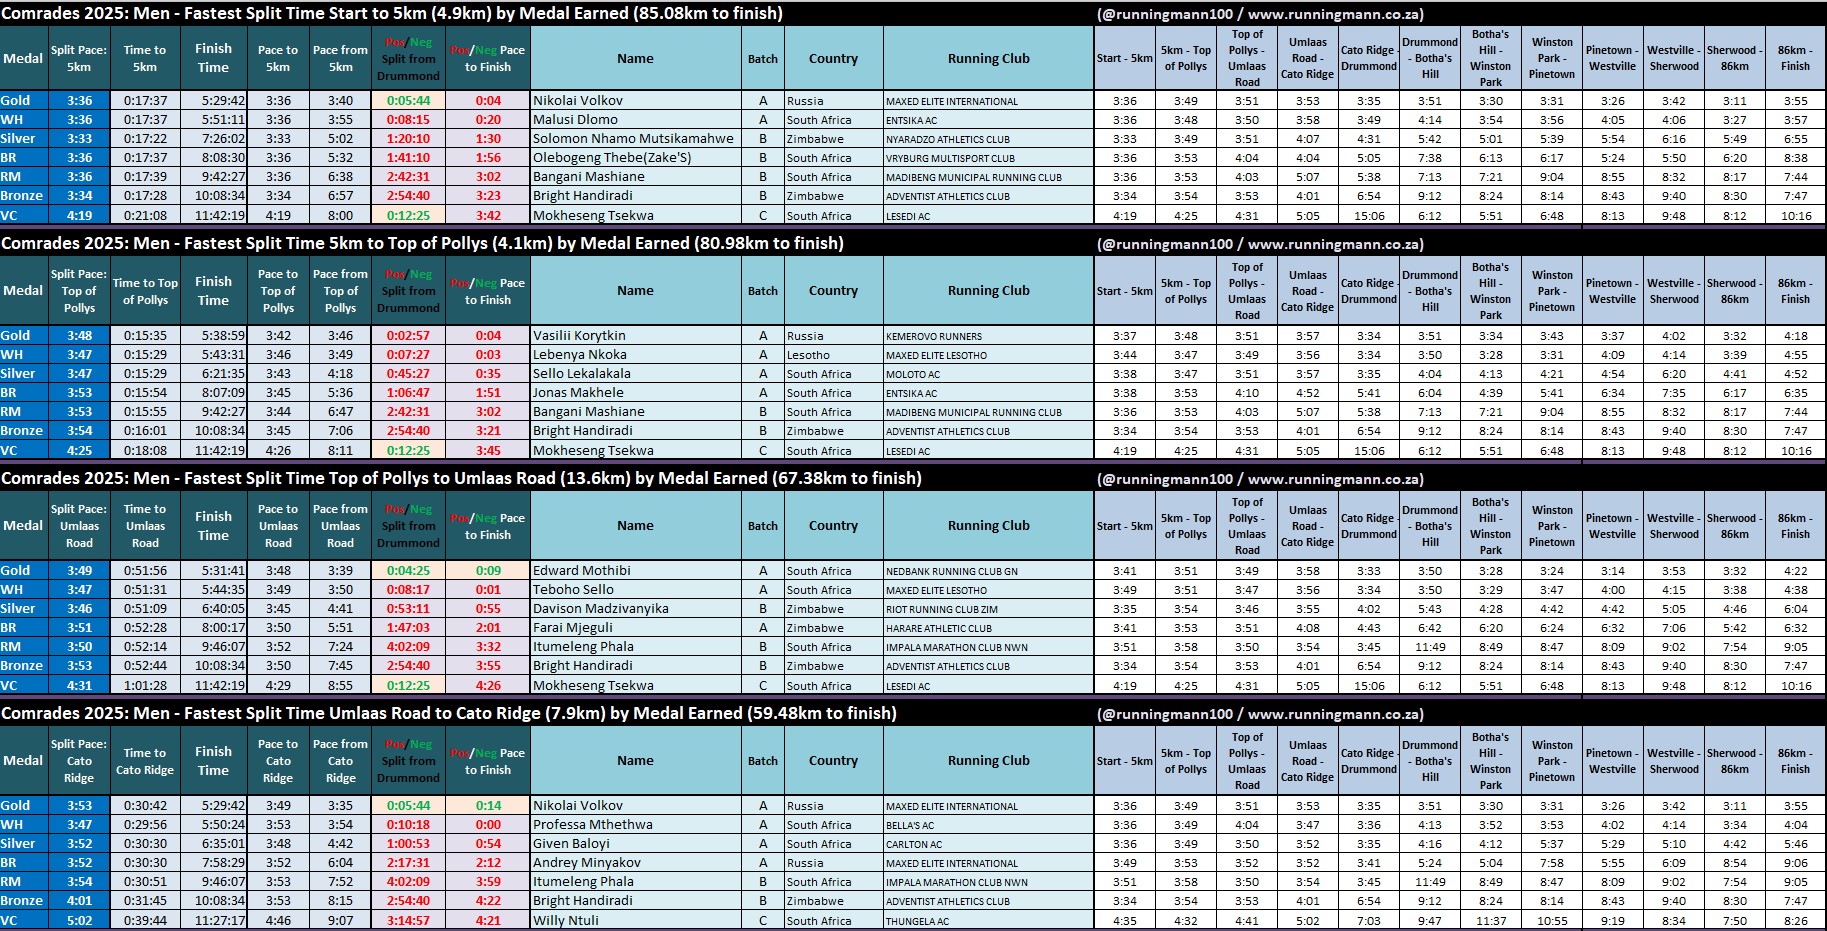
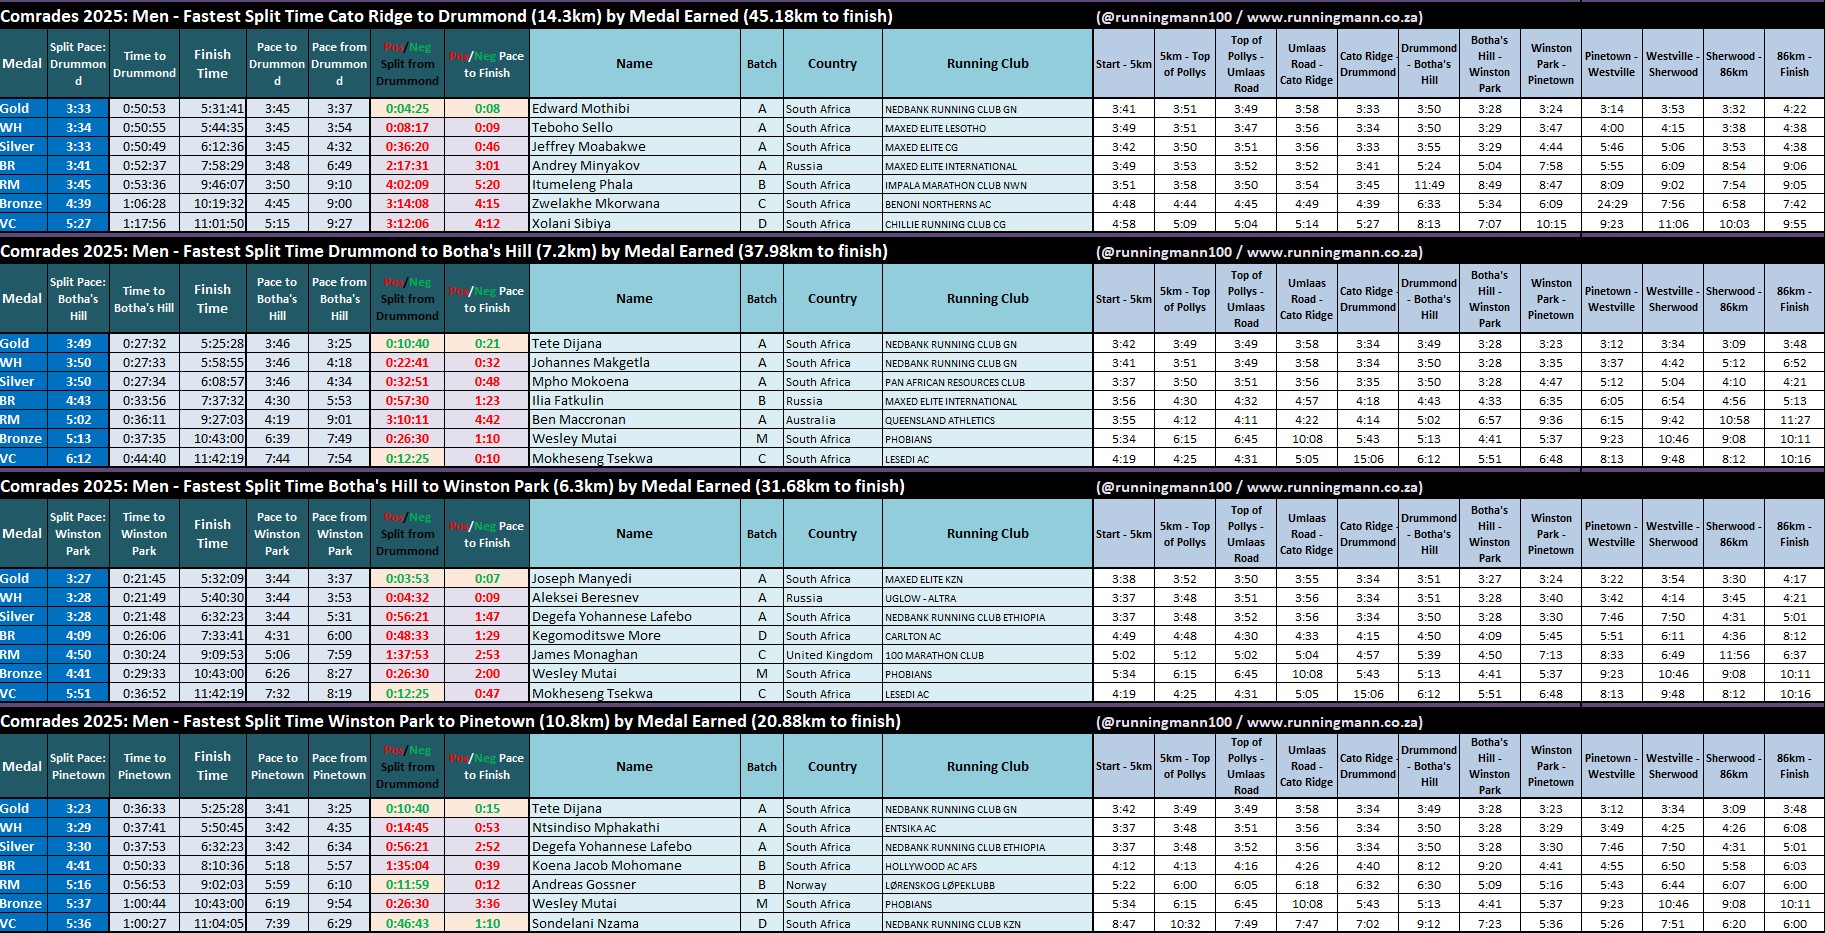


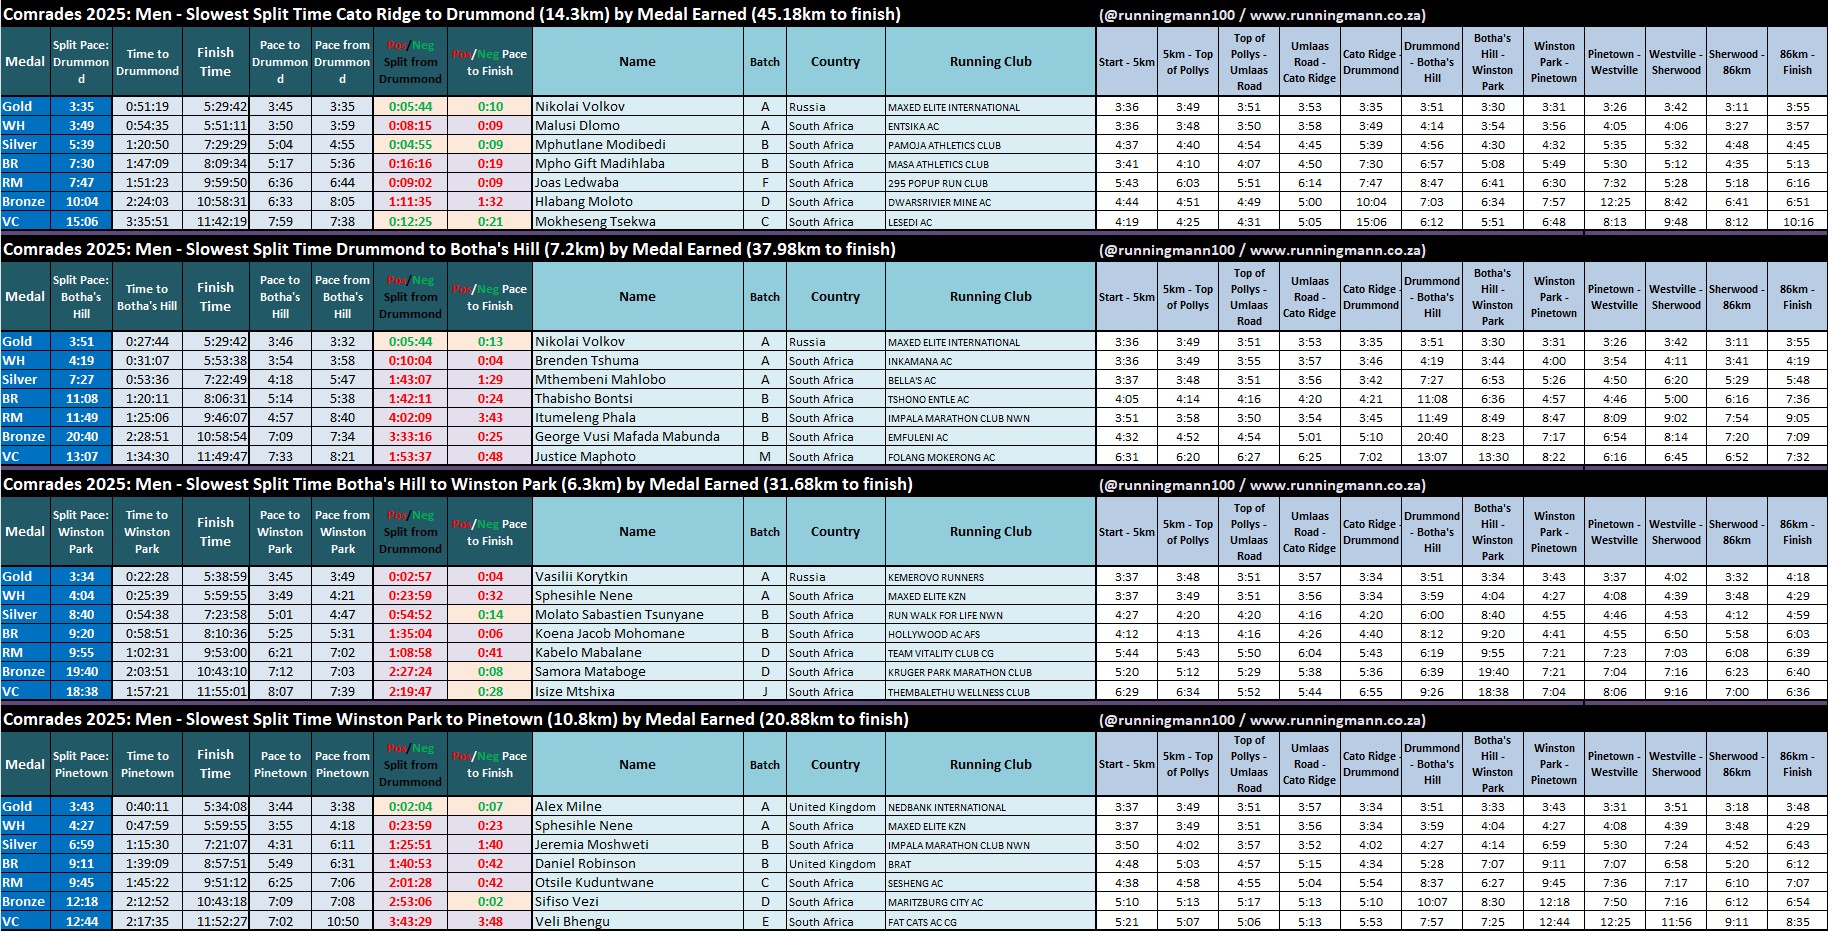
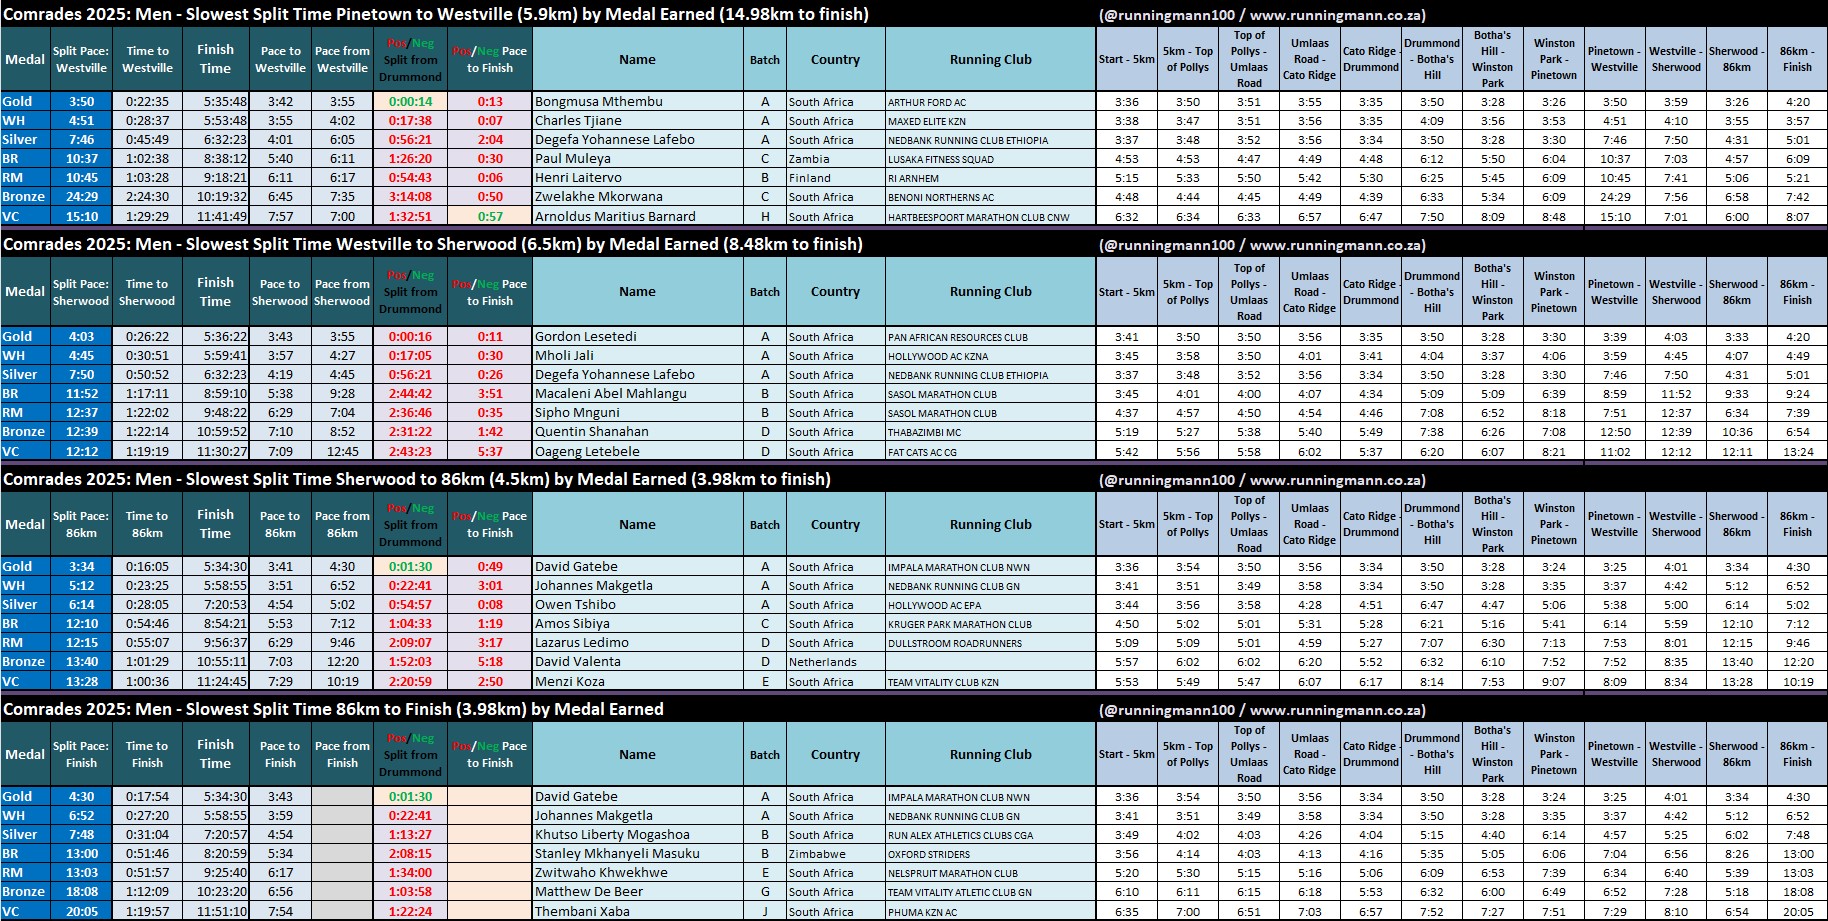
You will also see the trend that those running slowest first half splits and fast second half splits have a much higher probability of running a negative split / pace.
These tables show the women who ran the fastest and slowest between each split by medal (i.e. each split in isolation). As a general rule of thumb, it’s usually better to be on the slowest list before Drummond and the fastest list after Drummond.
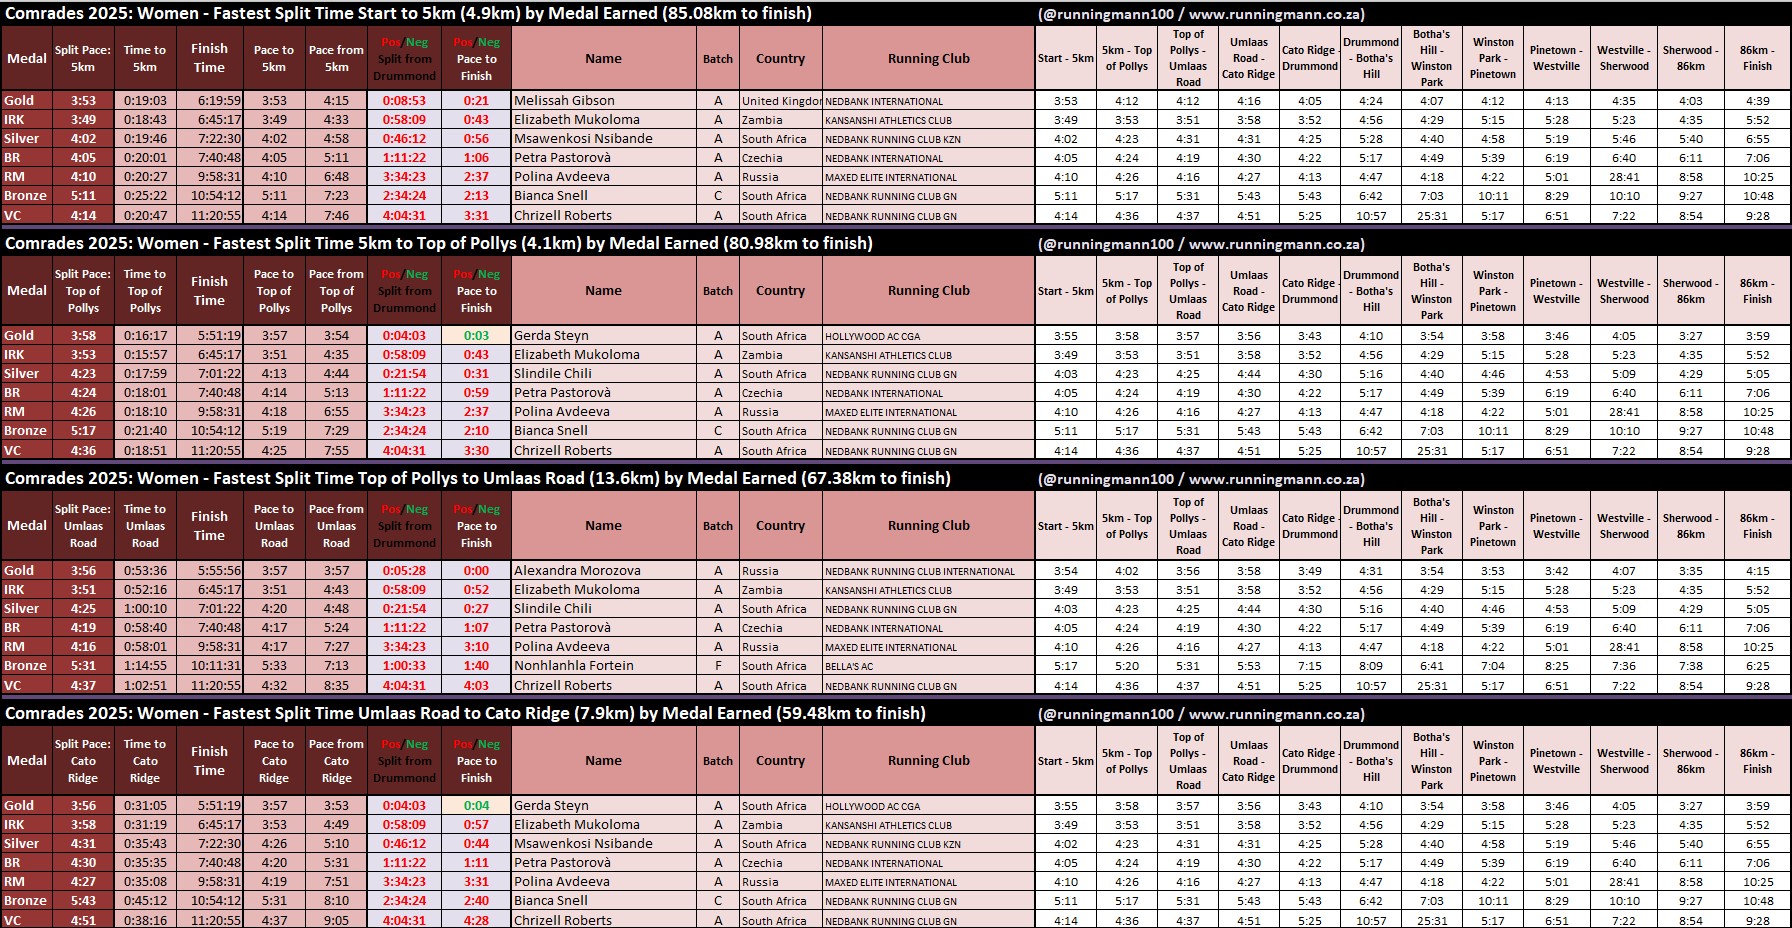


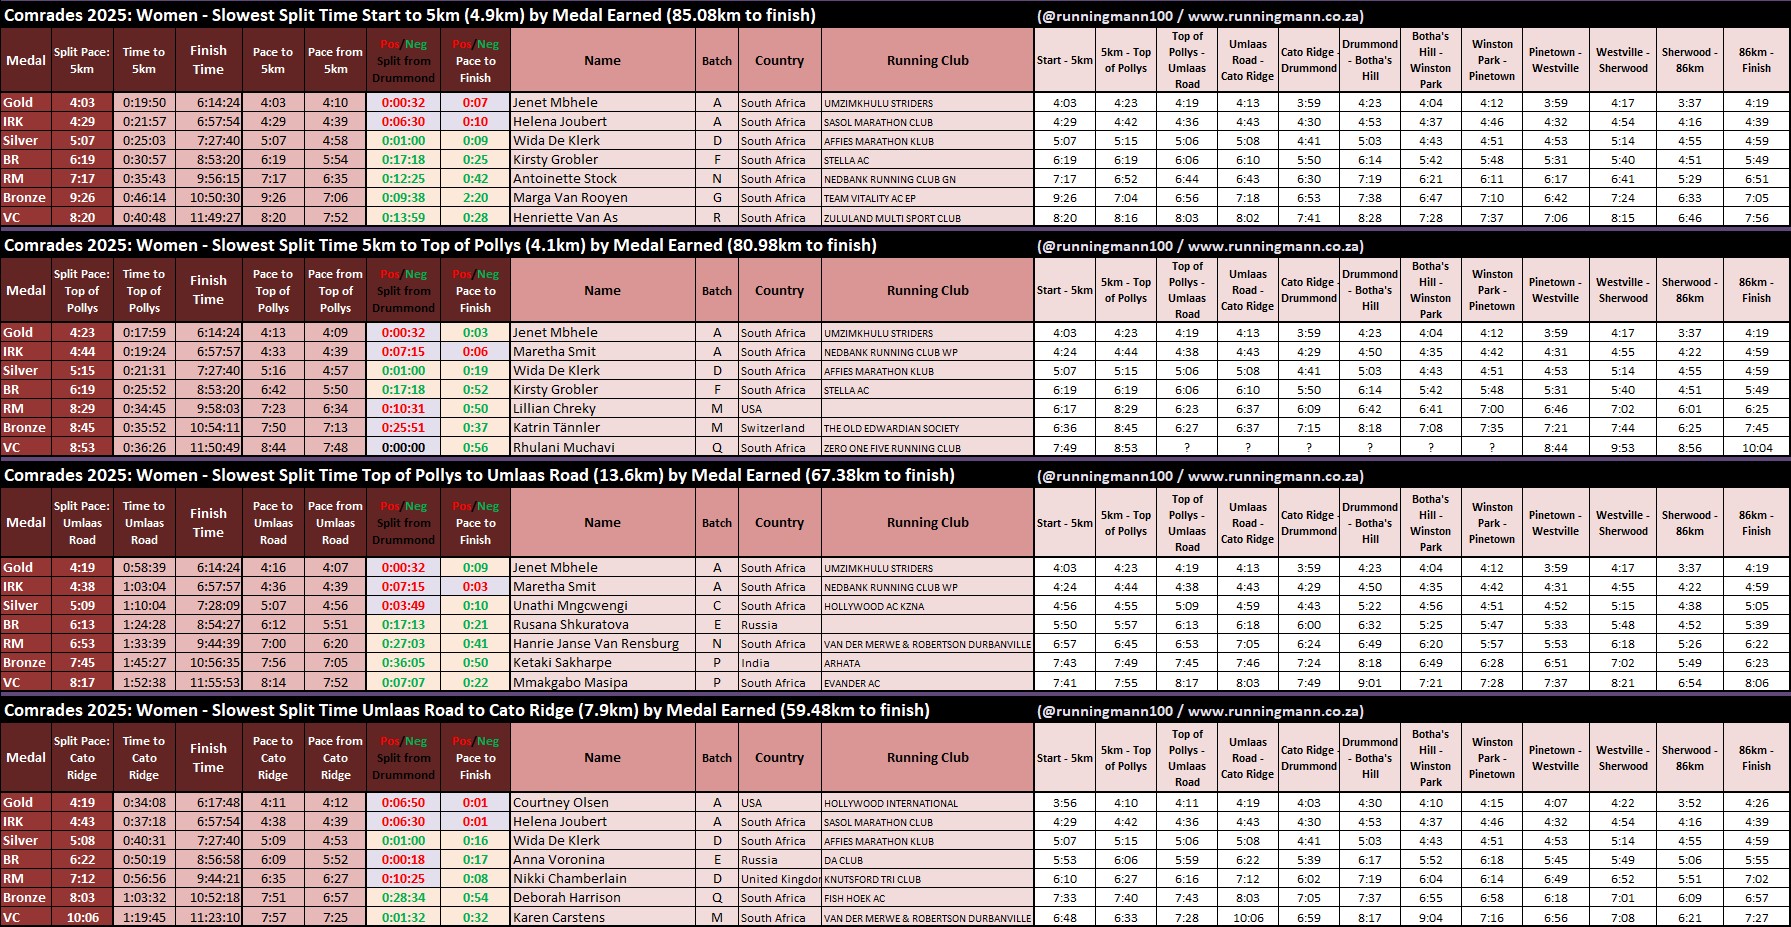


You will also see the trend that those running slowest first half splits and fast second half splits have a much higher probability of running a negative split / pace.
Additional Stats
If you would like a stat that does not appear in my articles or have an interesting idea, feel free to message me on social media or therunningmann@gmail.com.


Thanks for putting this together! Great as always
How did you calculate average time for S batch with the majority being DNFs?
It would also be interesting to see whether you could overlay finish times with qualifiers to get a line of best fit and come up with a new “marathon x 2.5” based on that
For average time it is only the finishers for each batch.
Hi Stuart! Very interesting stats. I think it would be interesting to do one for 2026. Seeing as it is the 99th comrades and many newer runners would have been persuaded to enter so that they can also run the 100th comrades. Maybe you can include stats on the different provinces of the runners that entered and which marathons they use to qualify. Also runners from smaller running clubs